How to Read the Outputs
| Output type | Used for | Manual offsets? | Used in quantitative metrics? |
|---|---|---|---|
| Original geographic layout | Baseline | No | Yes |
| Formula-derived exploded layout | Validation | No | Yes |
| Display-offset layout | Publication figures / web gallery | Yes, documented | Only if explicitly stated |
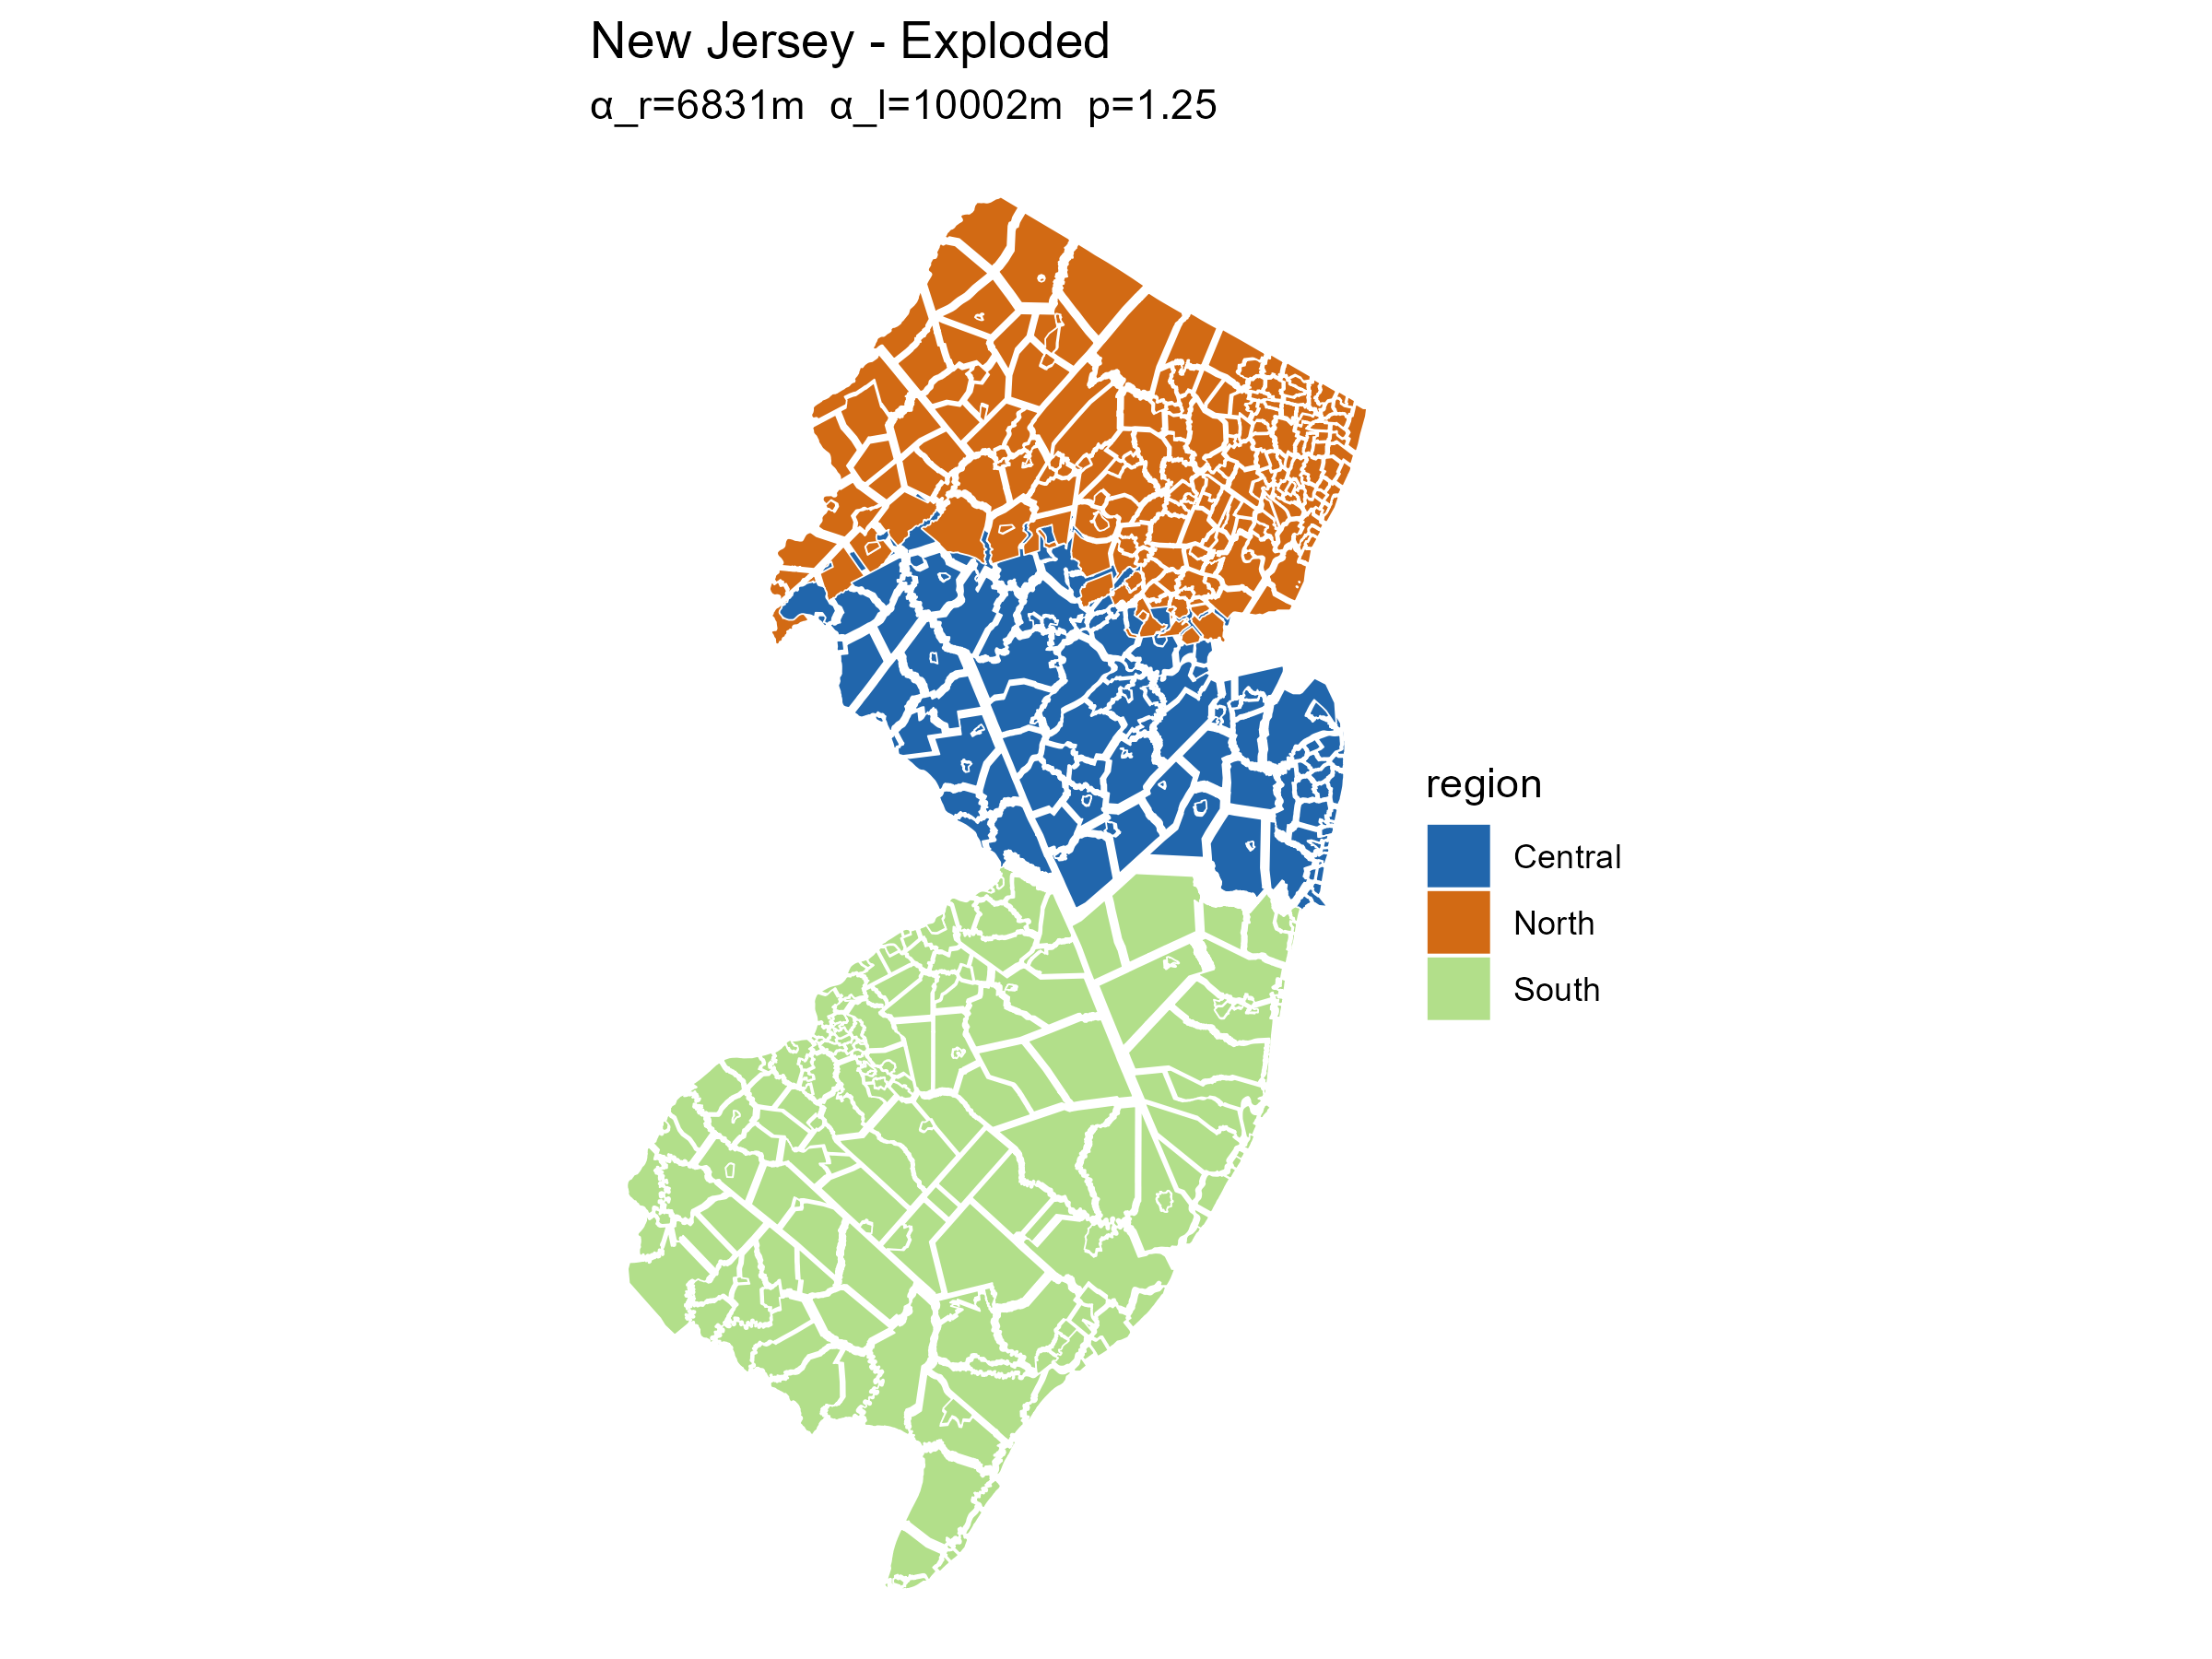
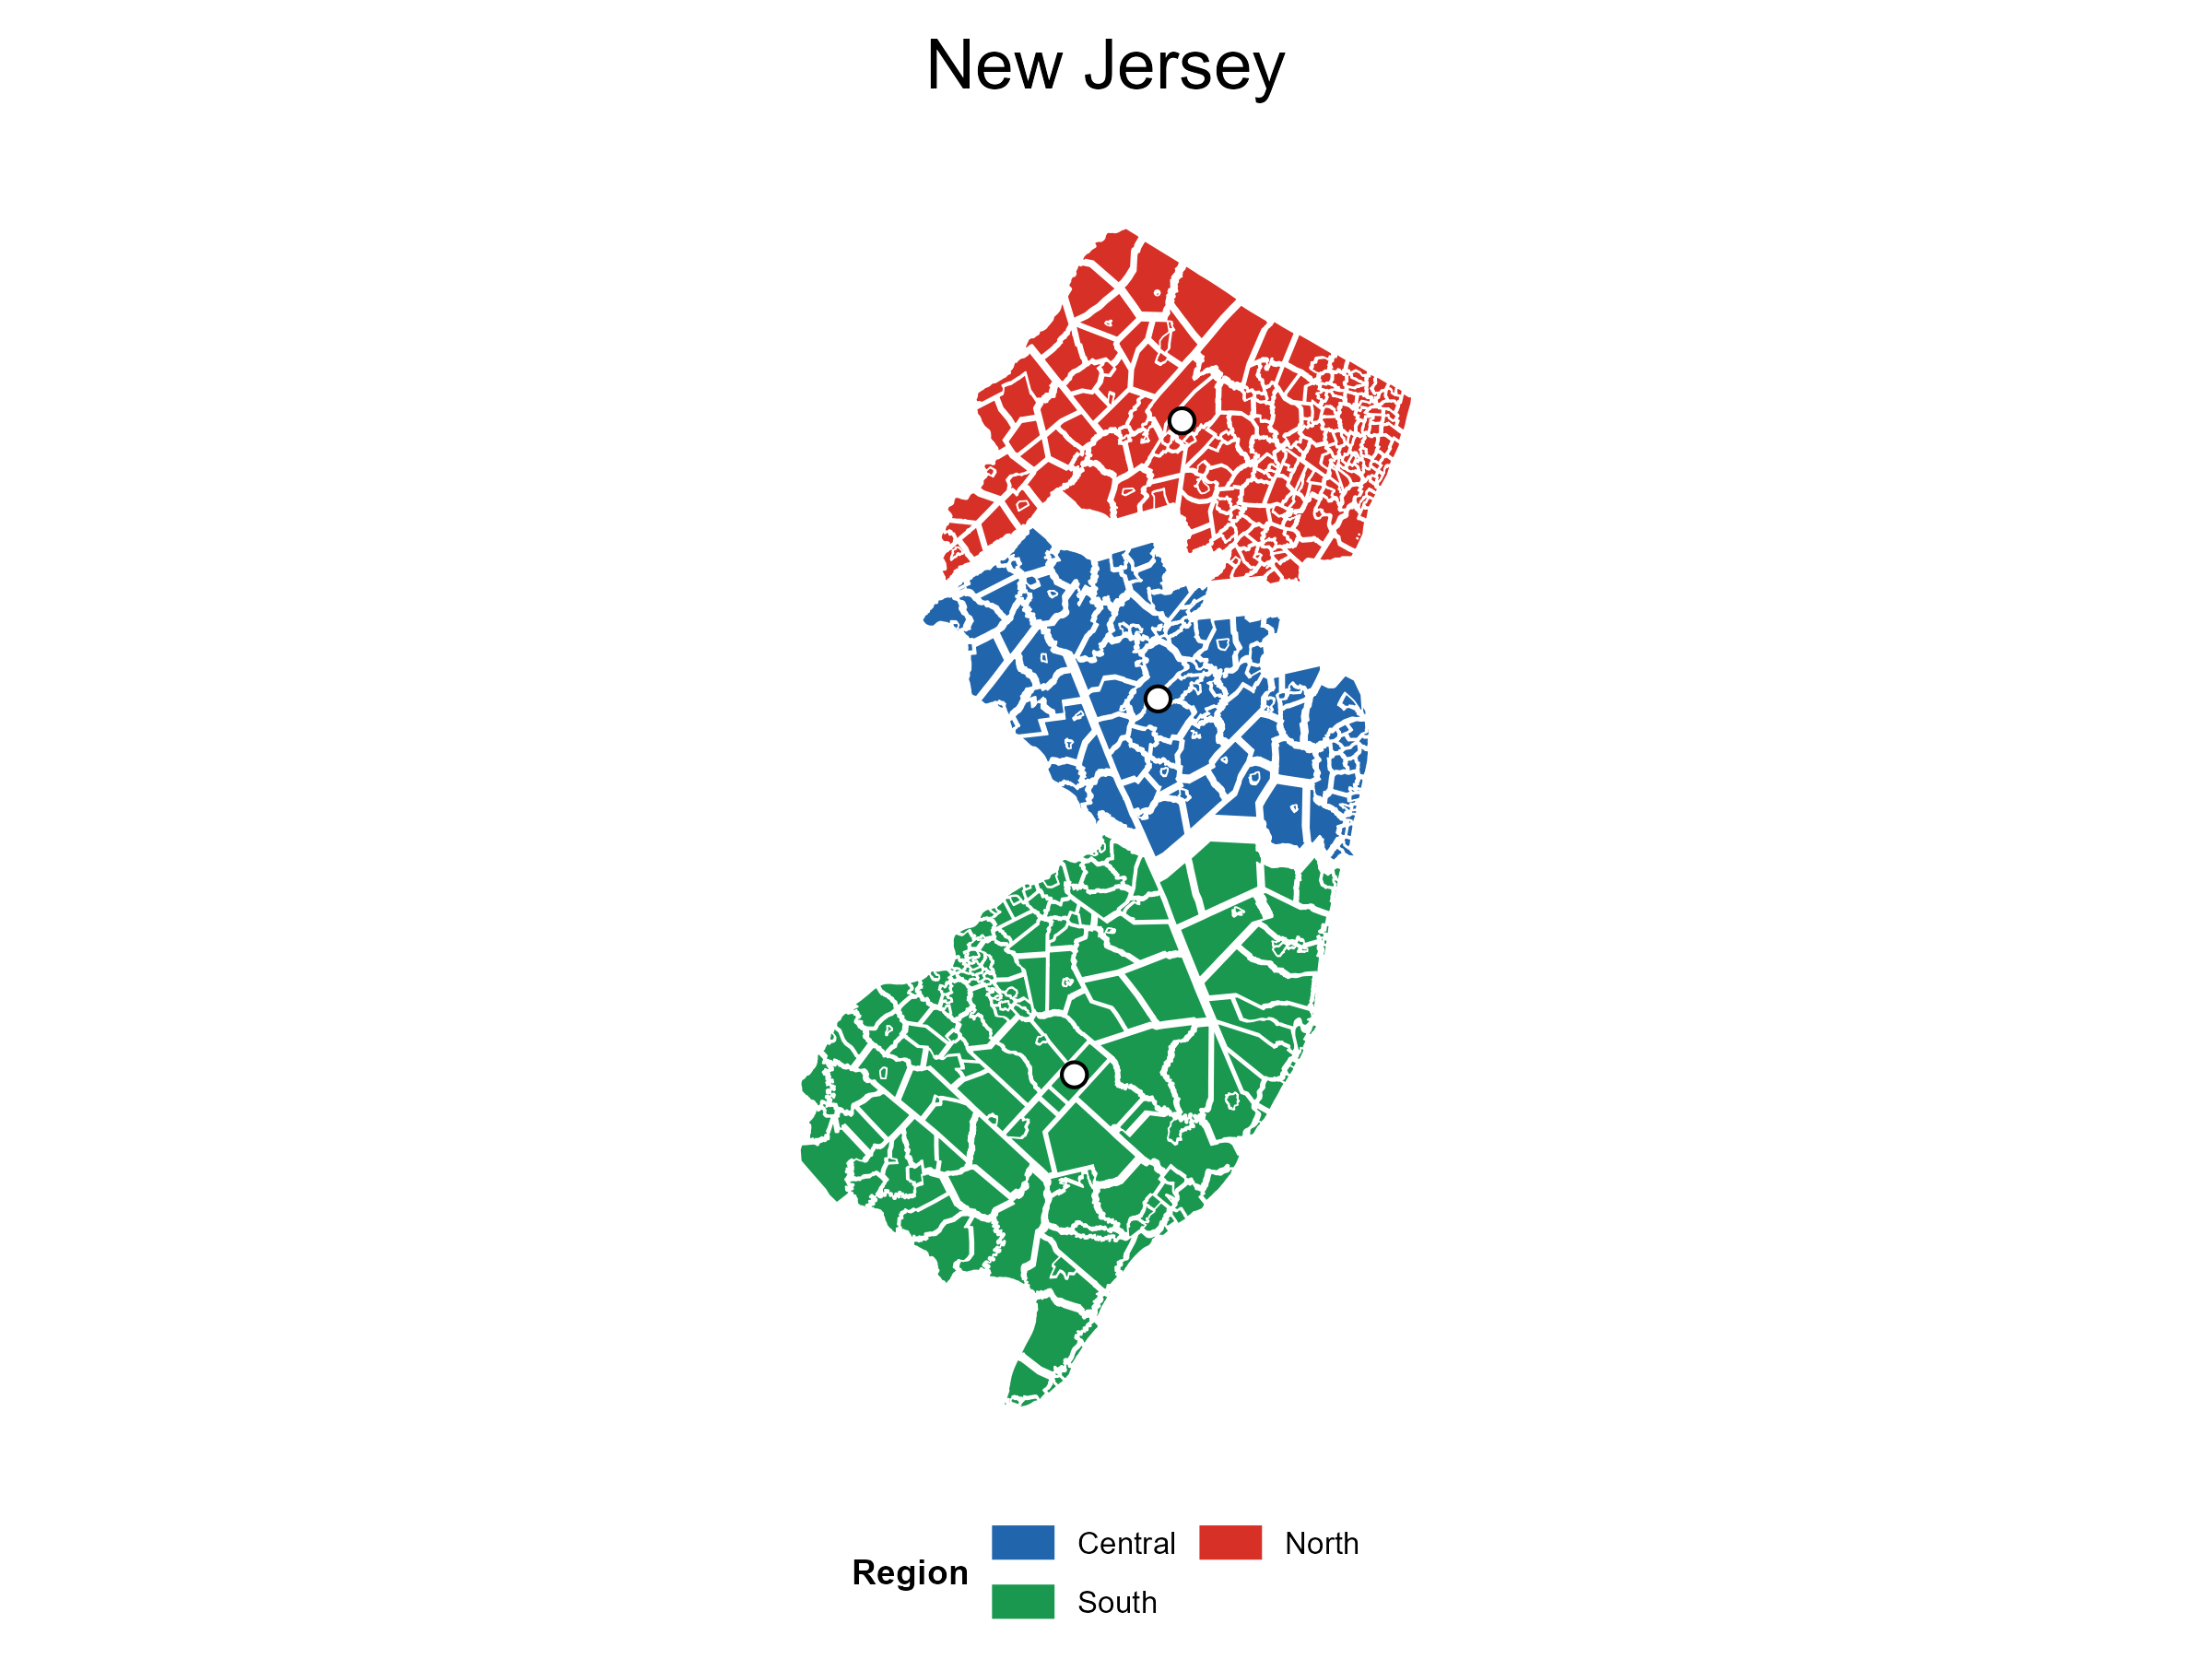
New Jersey
Formula-derived and display-offset layouts for the calibration case. The display offsets are documented separately from the analytical validation output.
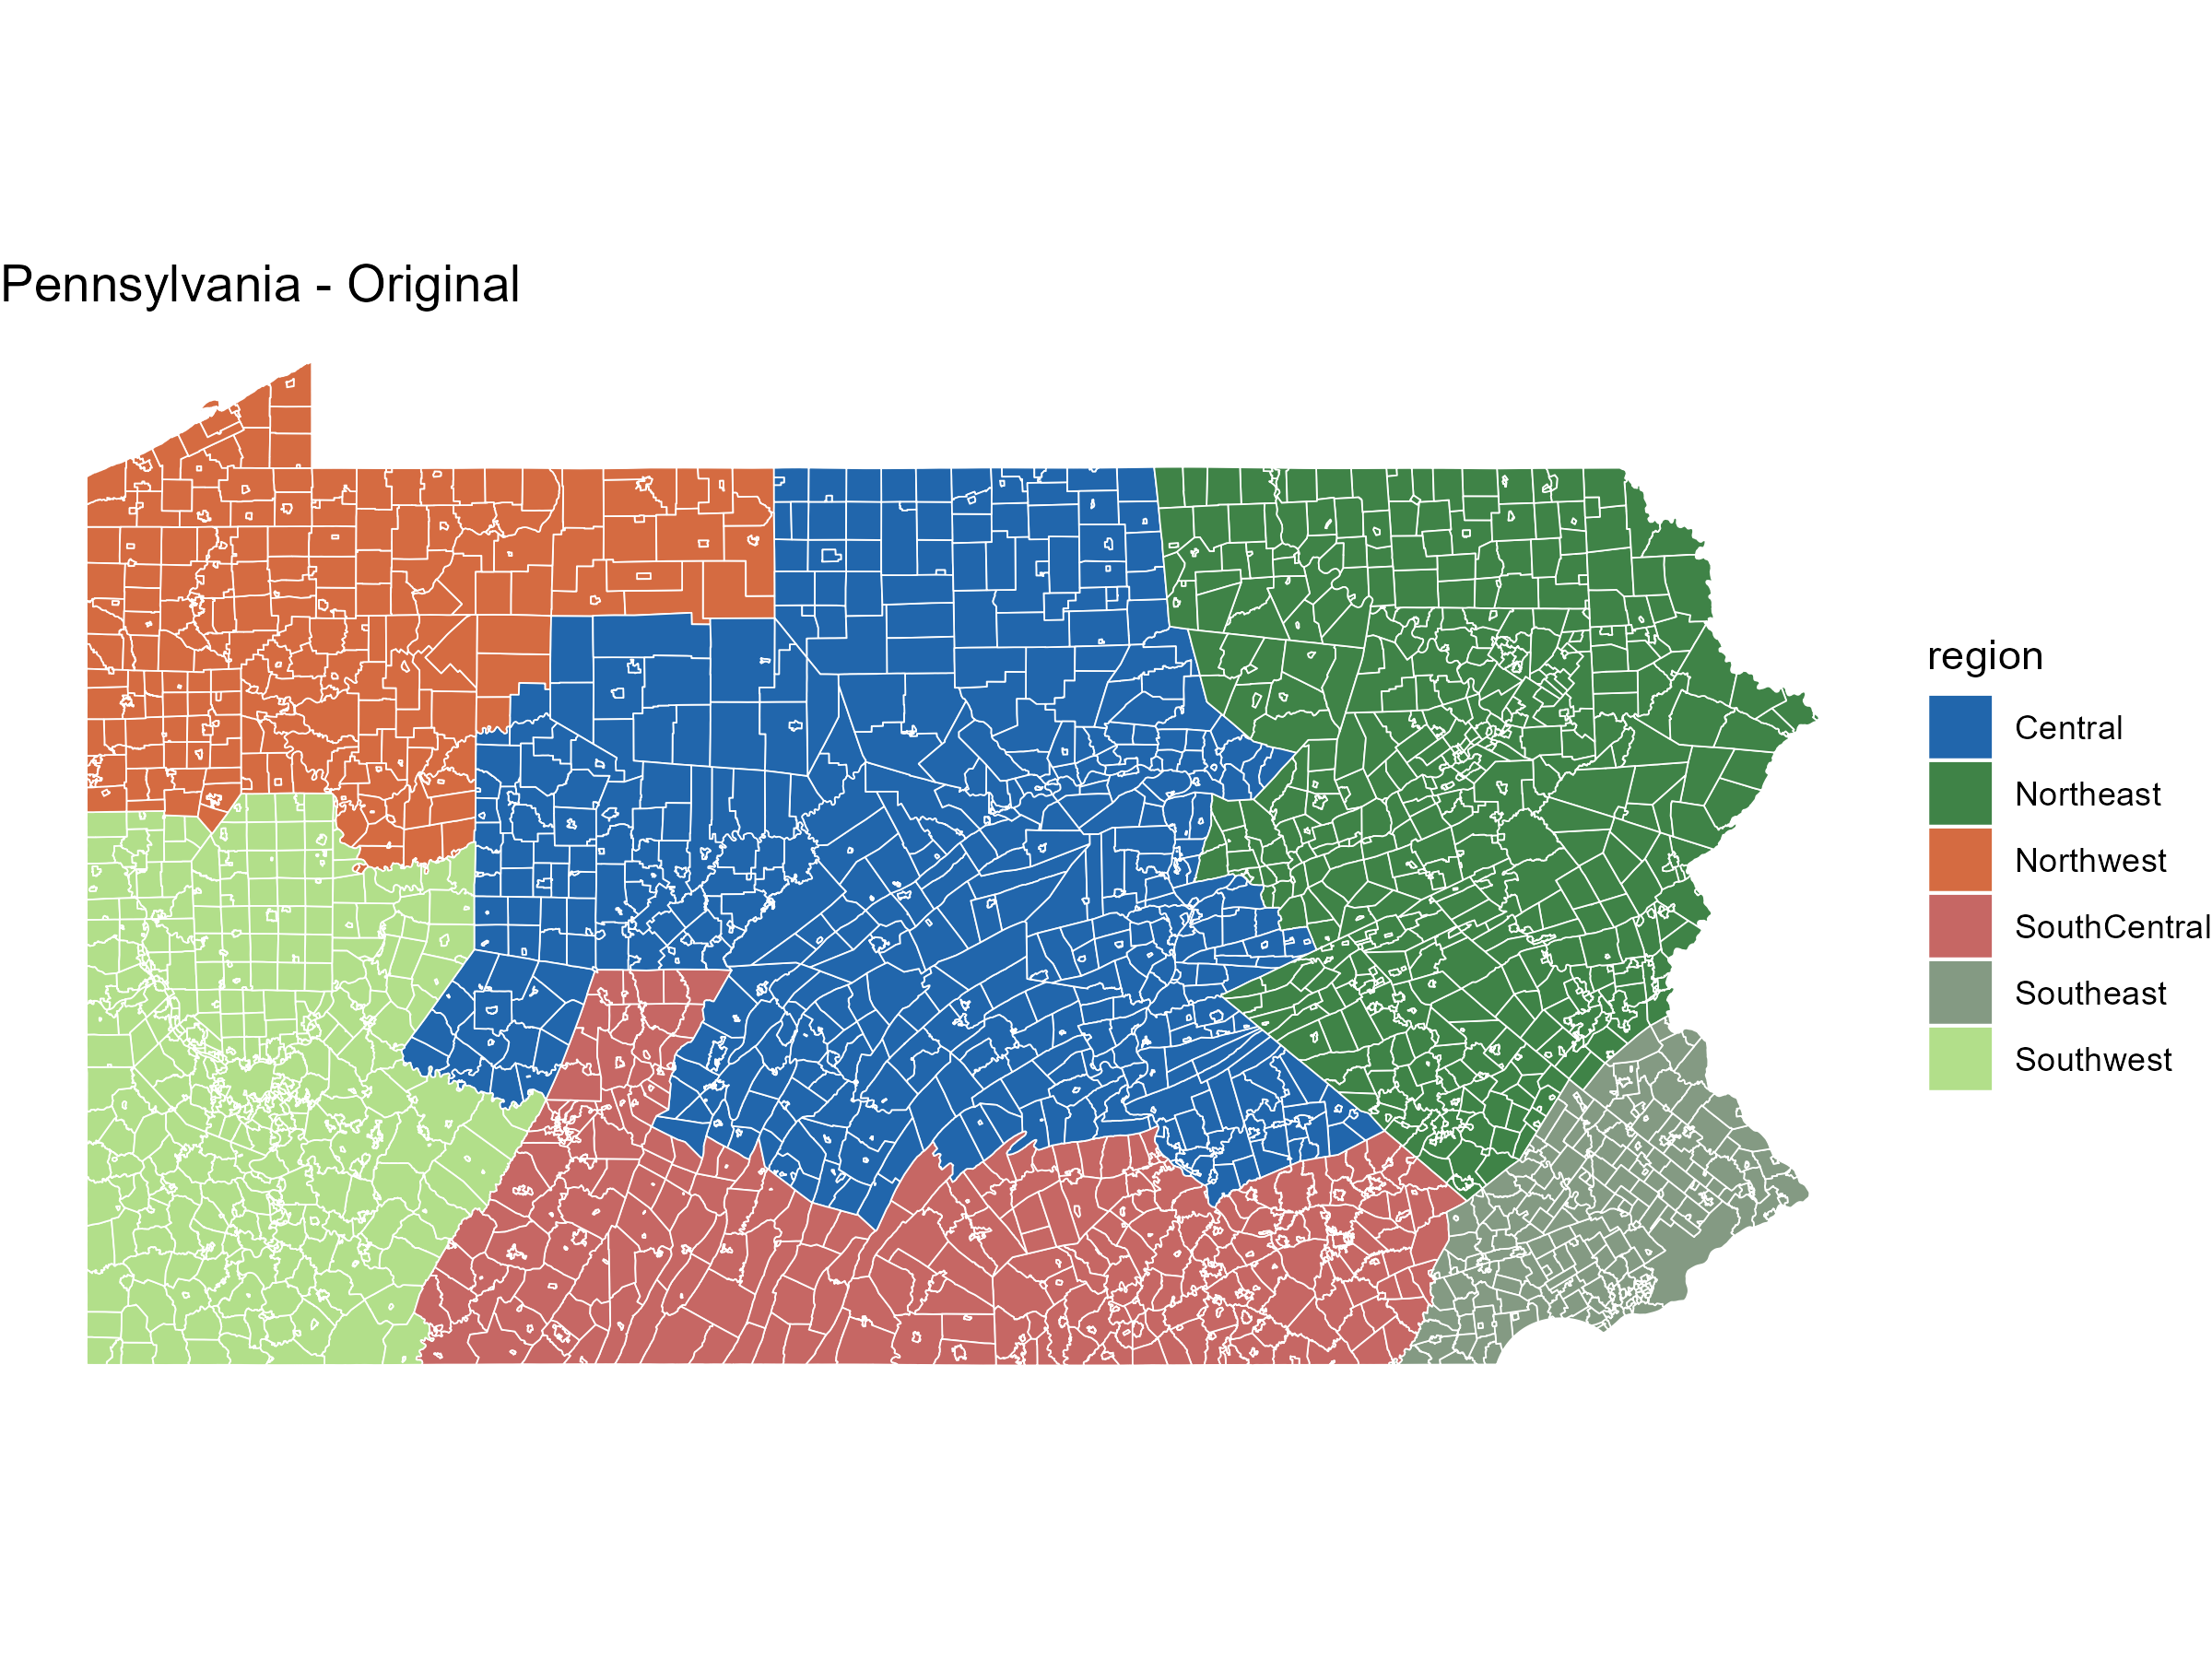
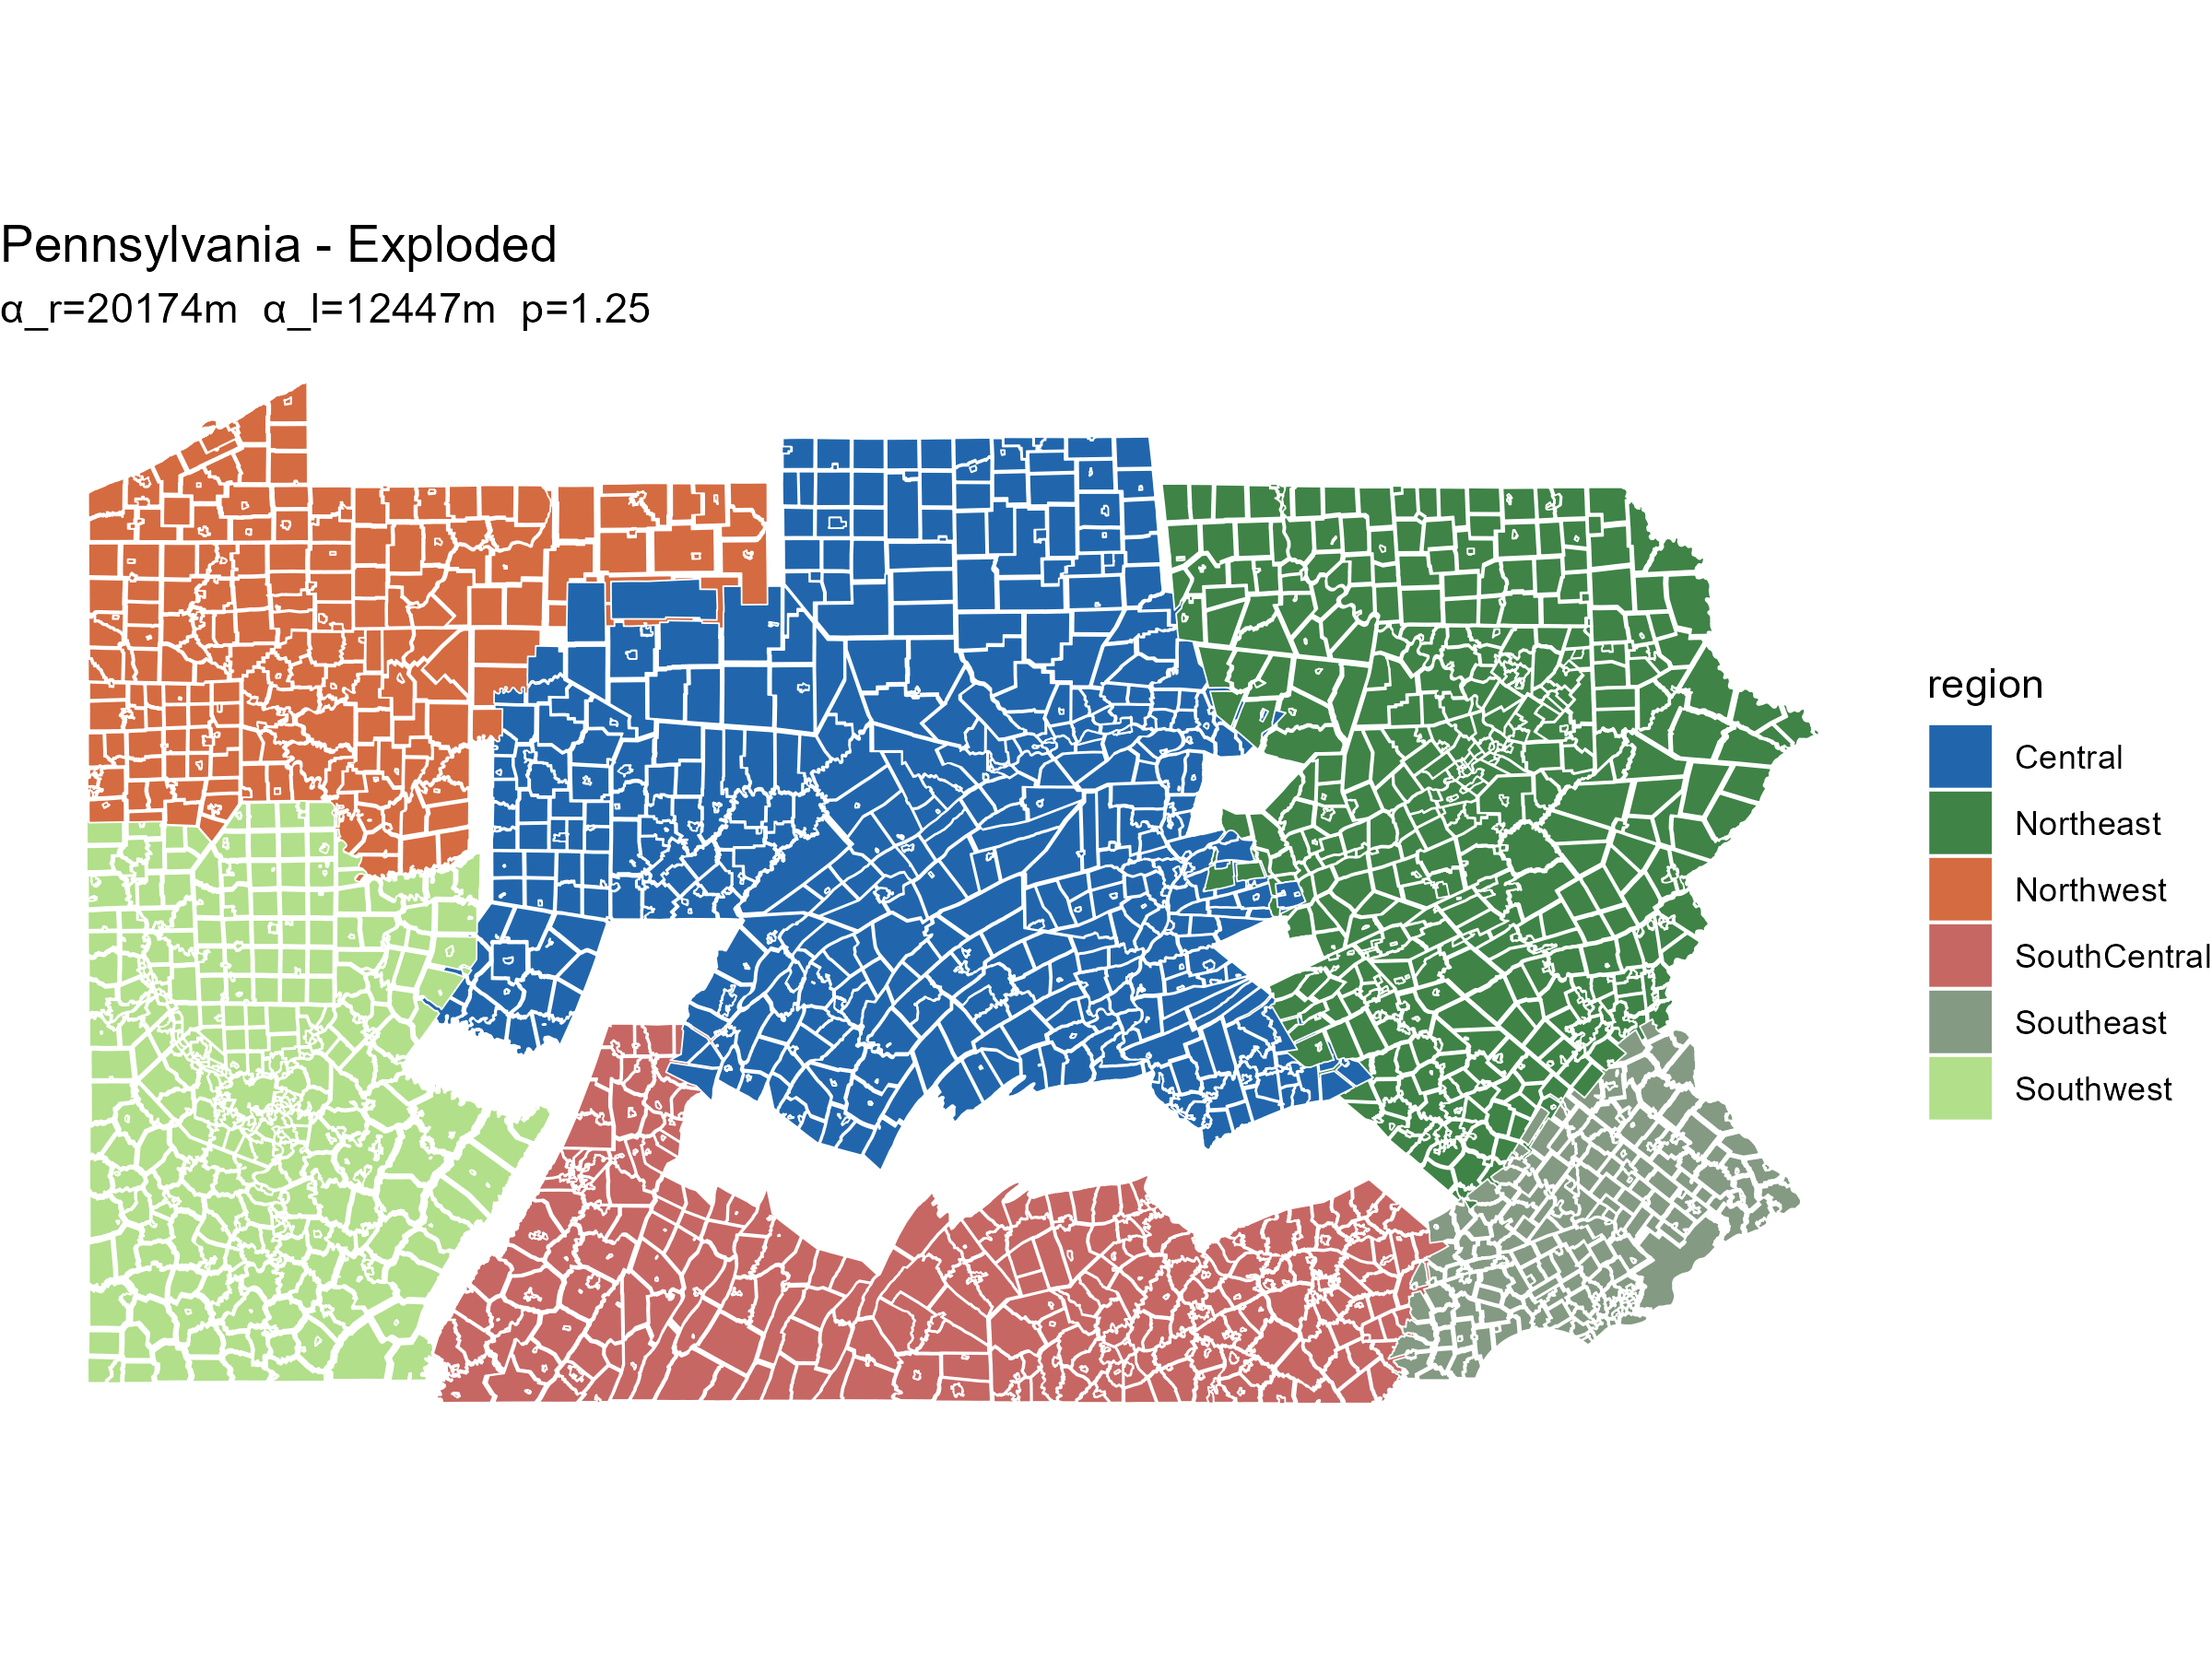
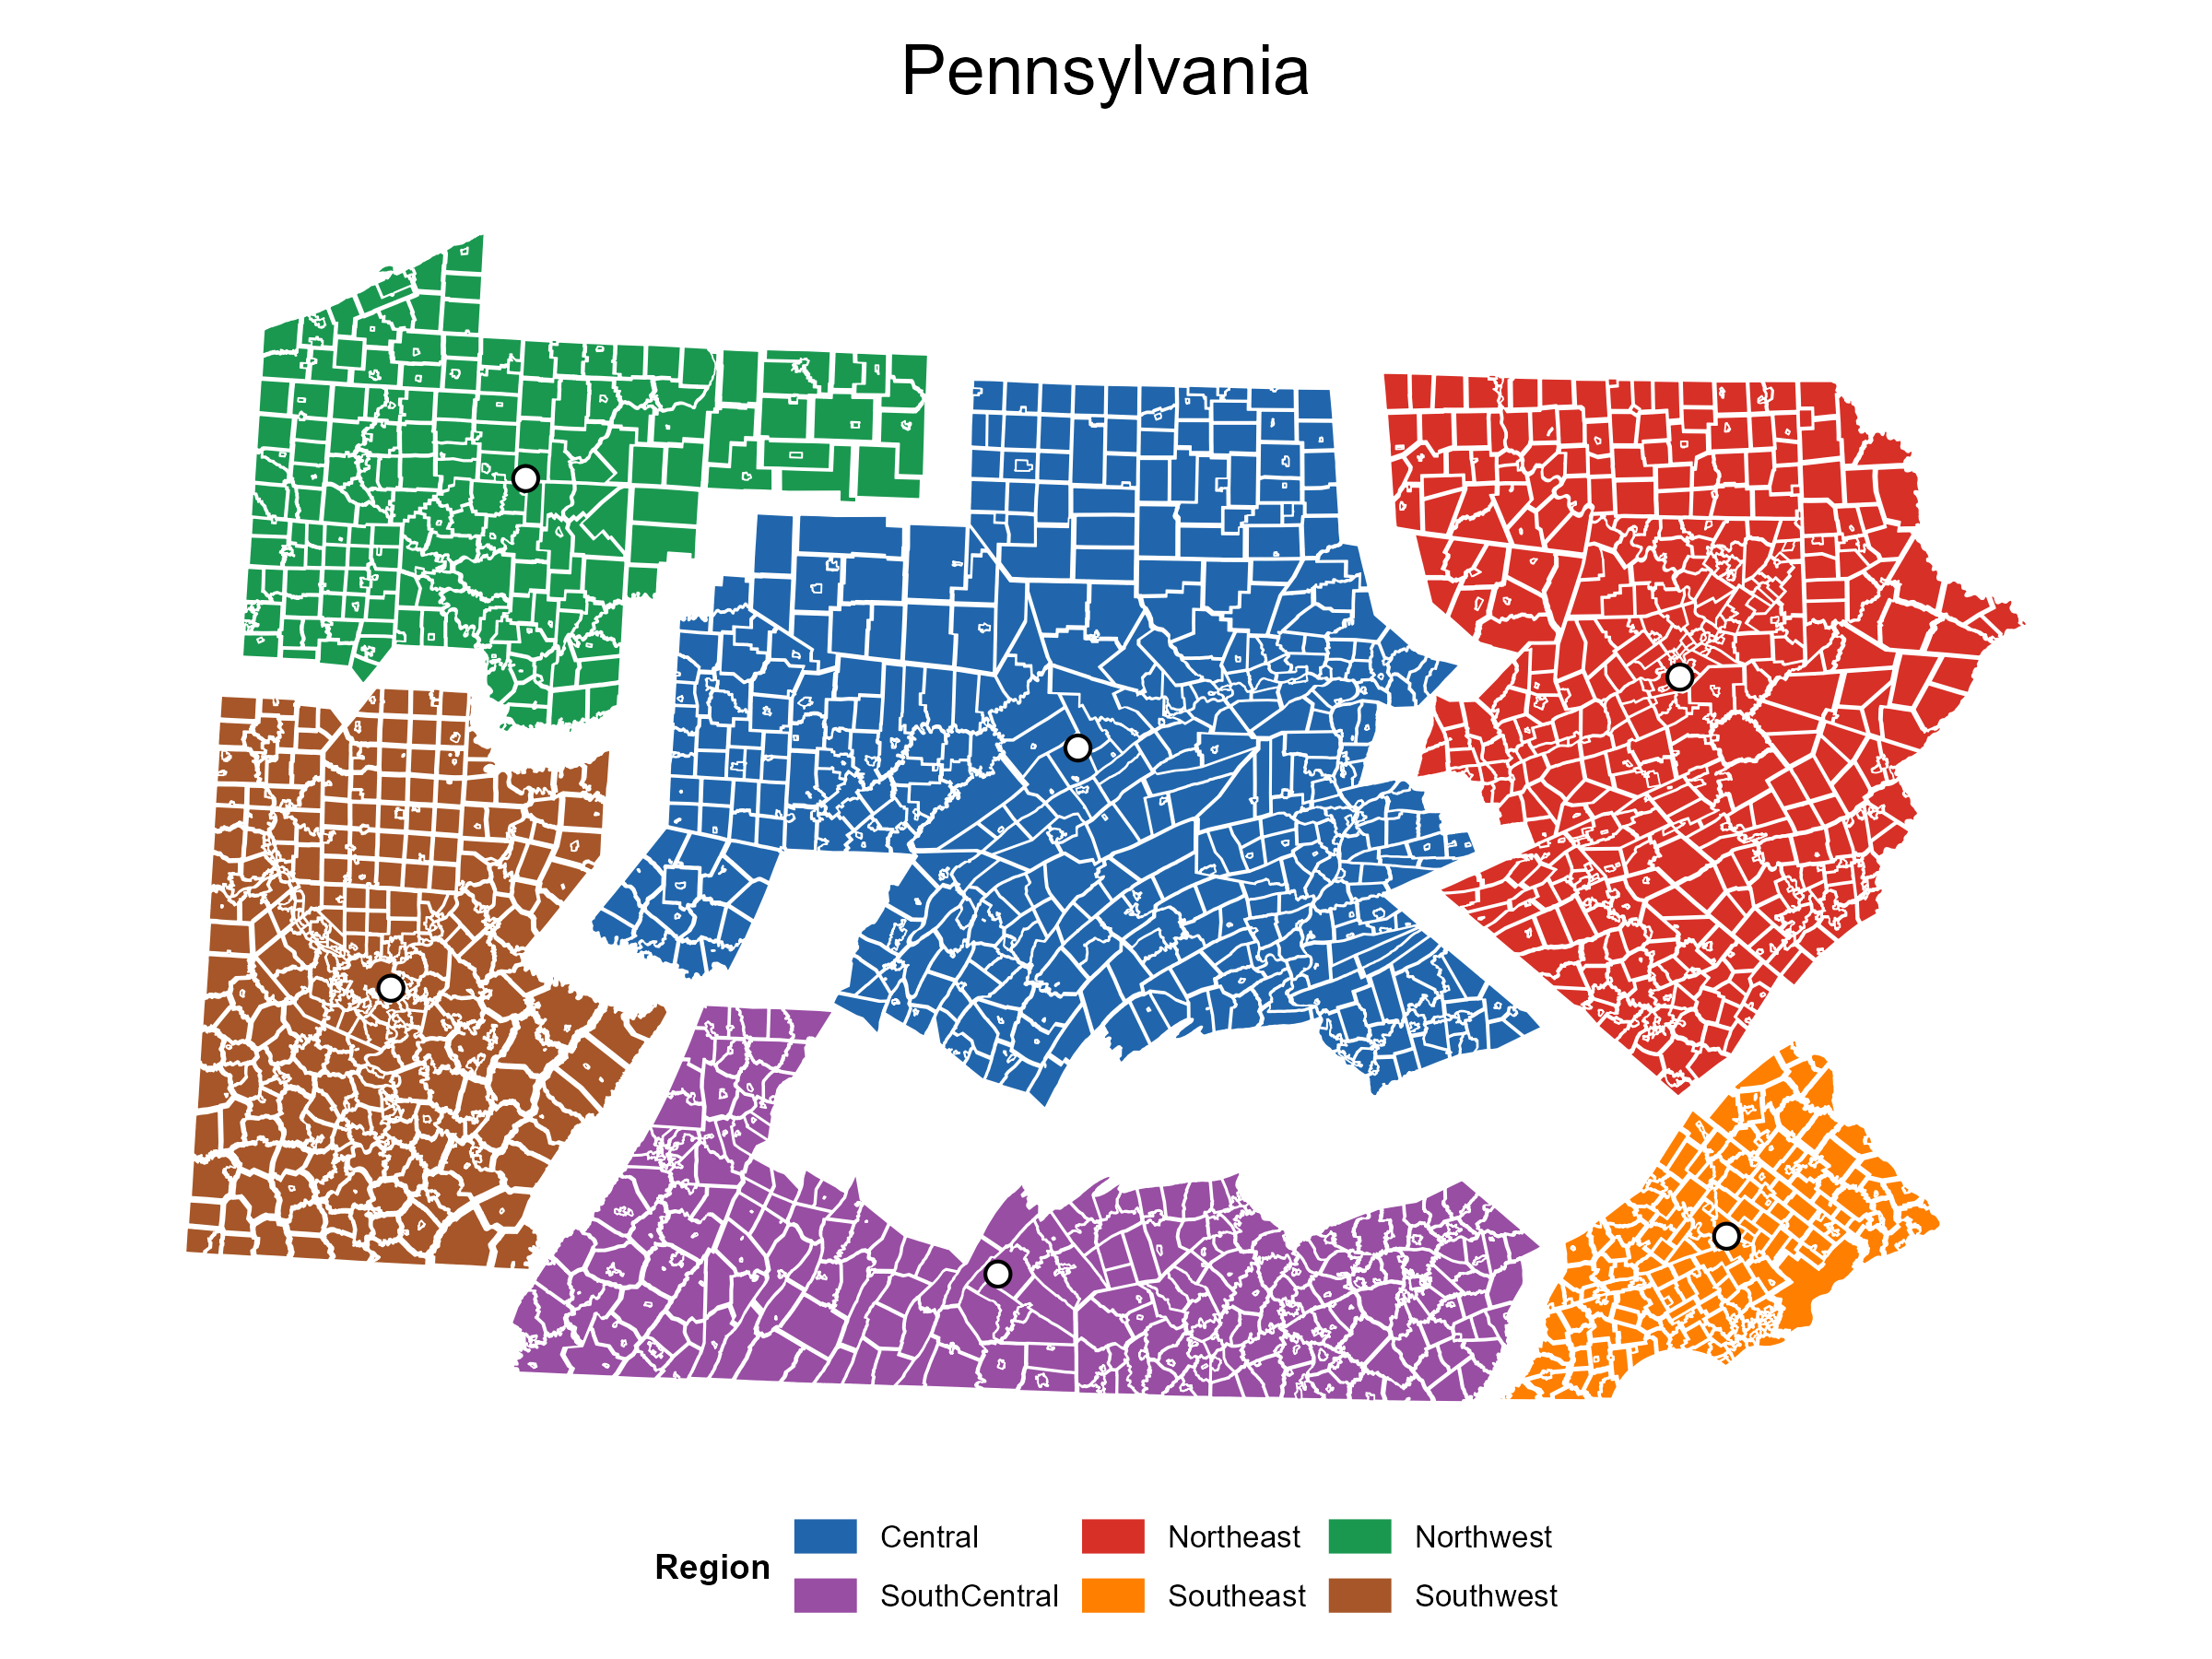
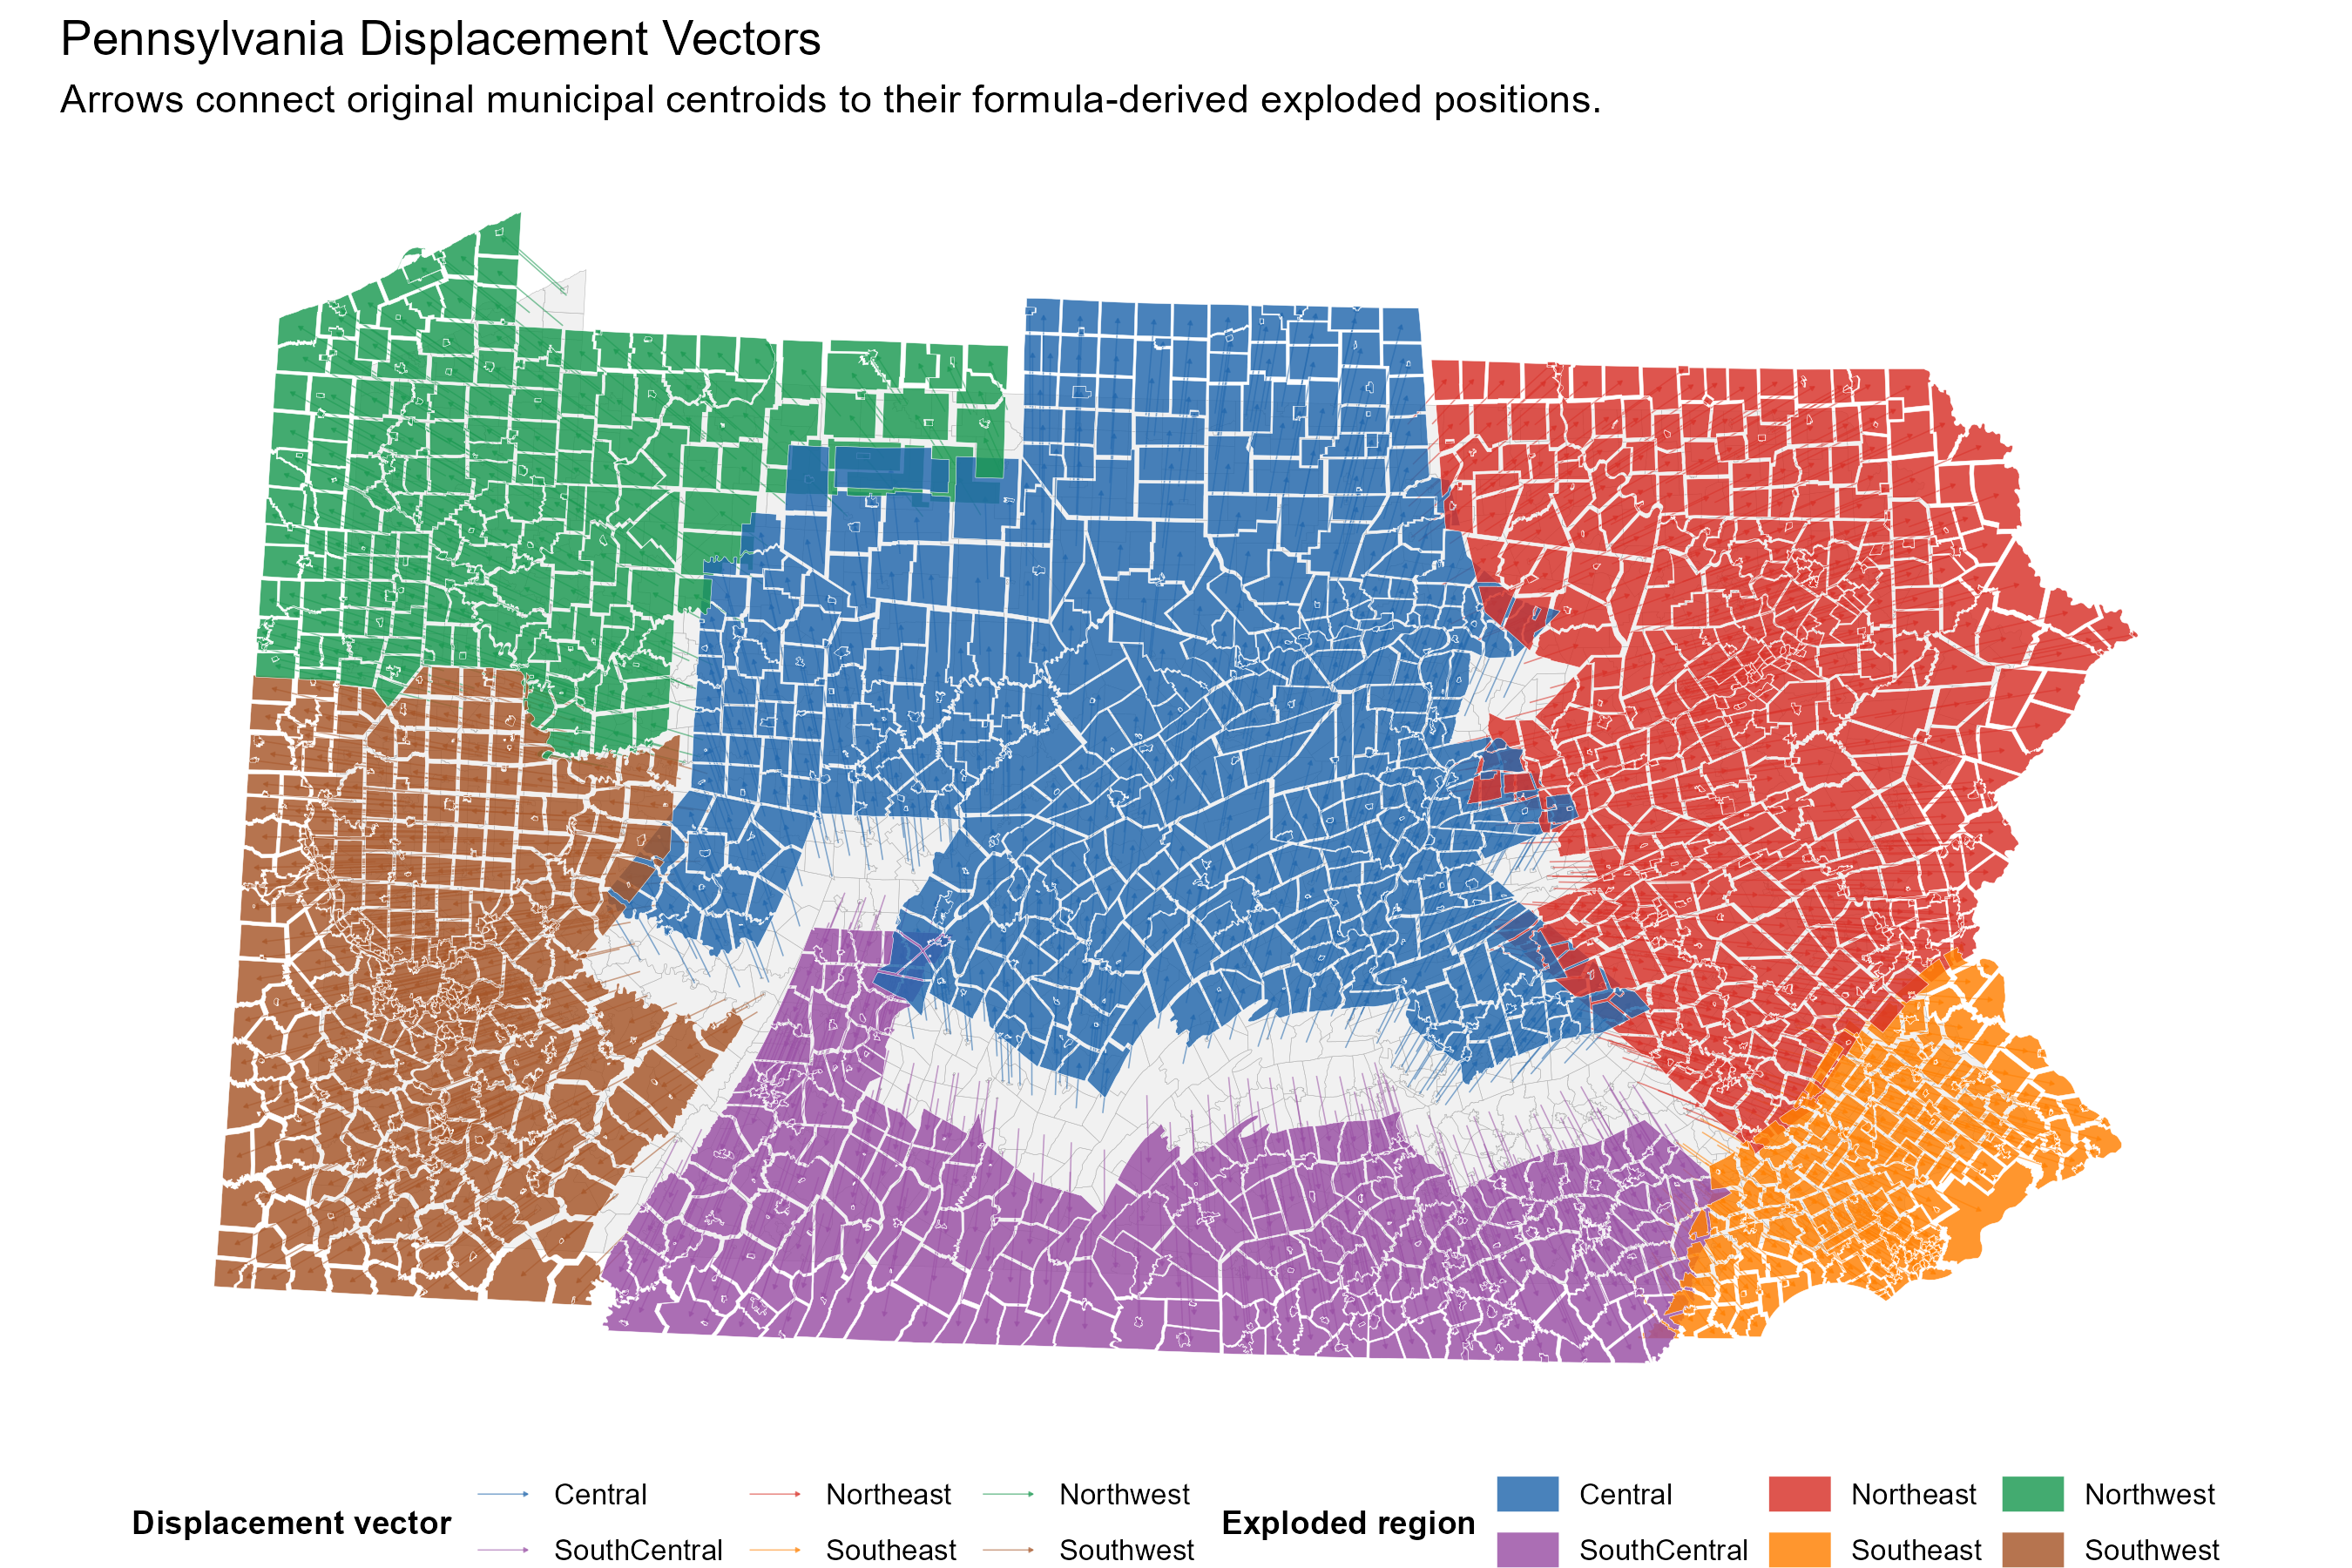
Pennsylvania
The Pennsylvania case includes the original geography, the formula-derived validation output, the display-offset figure, and a displacement-vector diagnostic showing how municipal units are pulled apart.
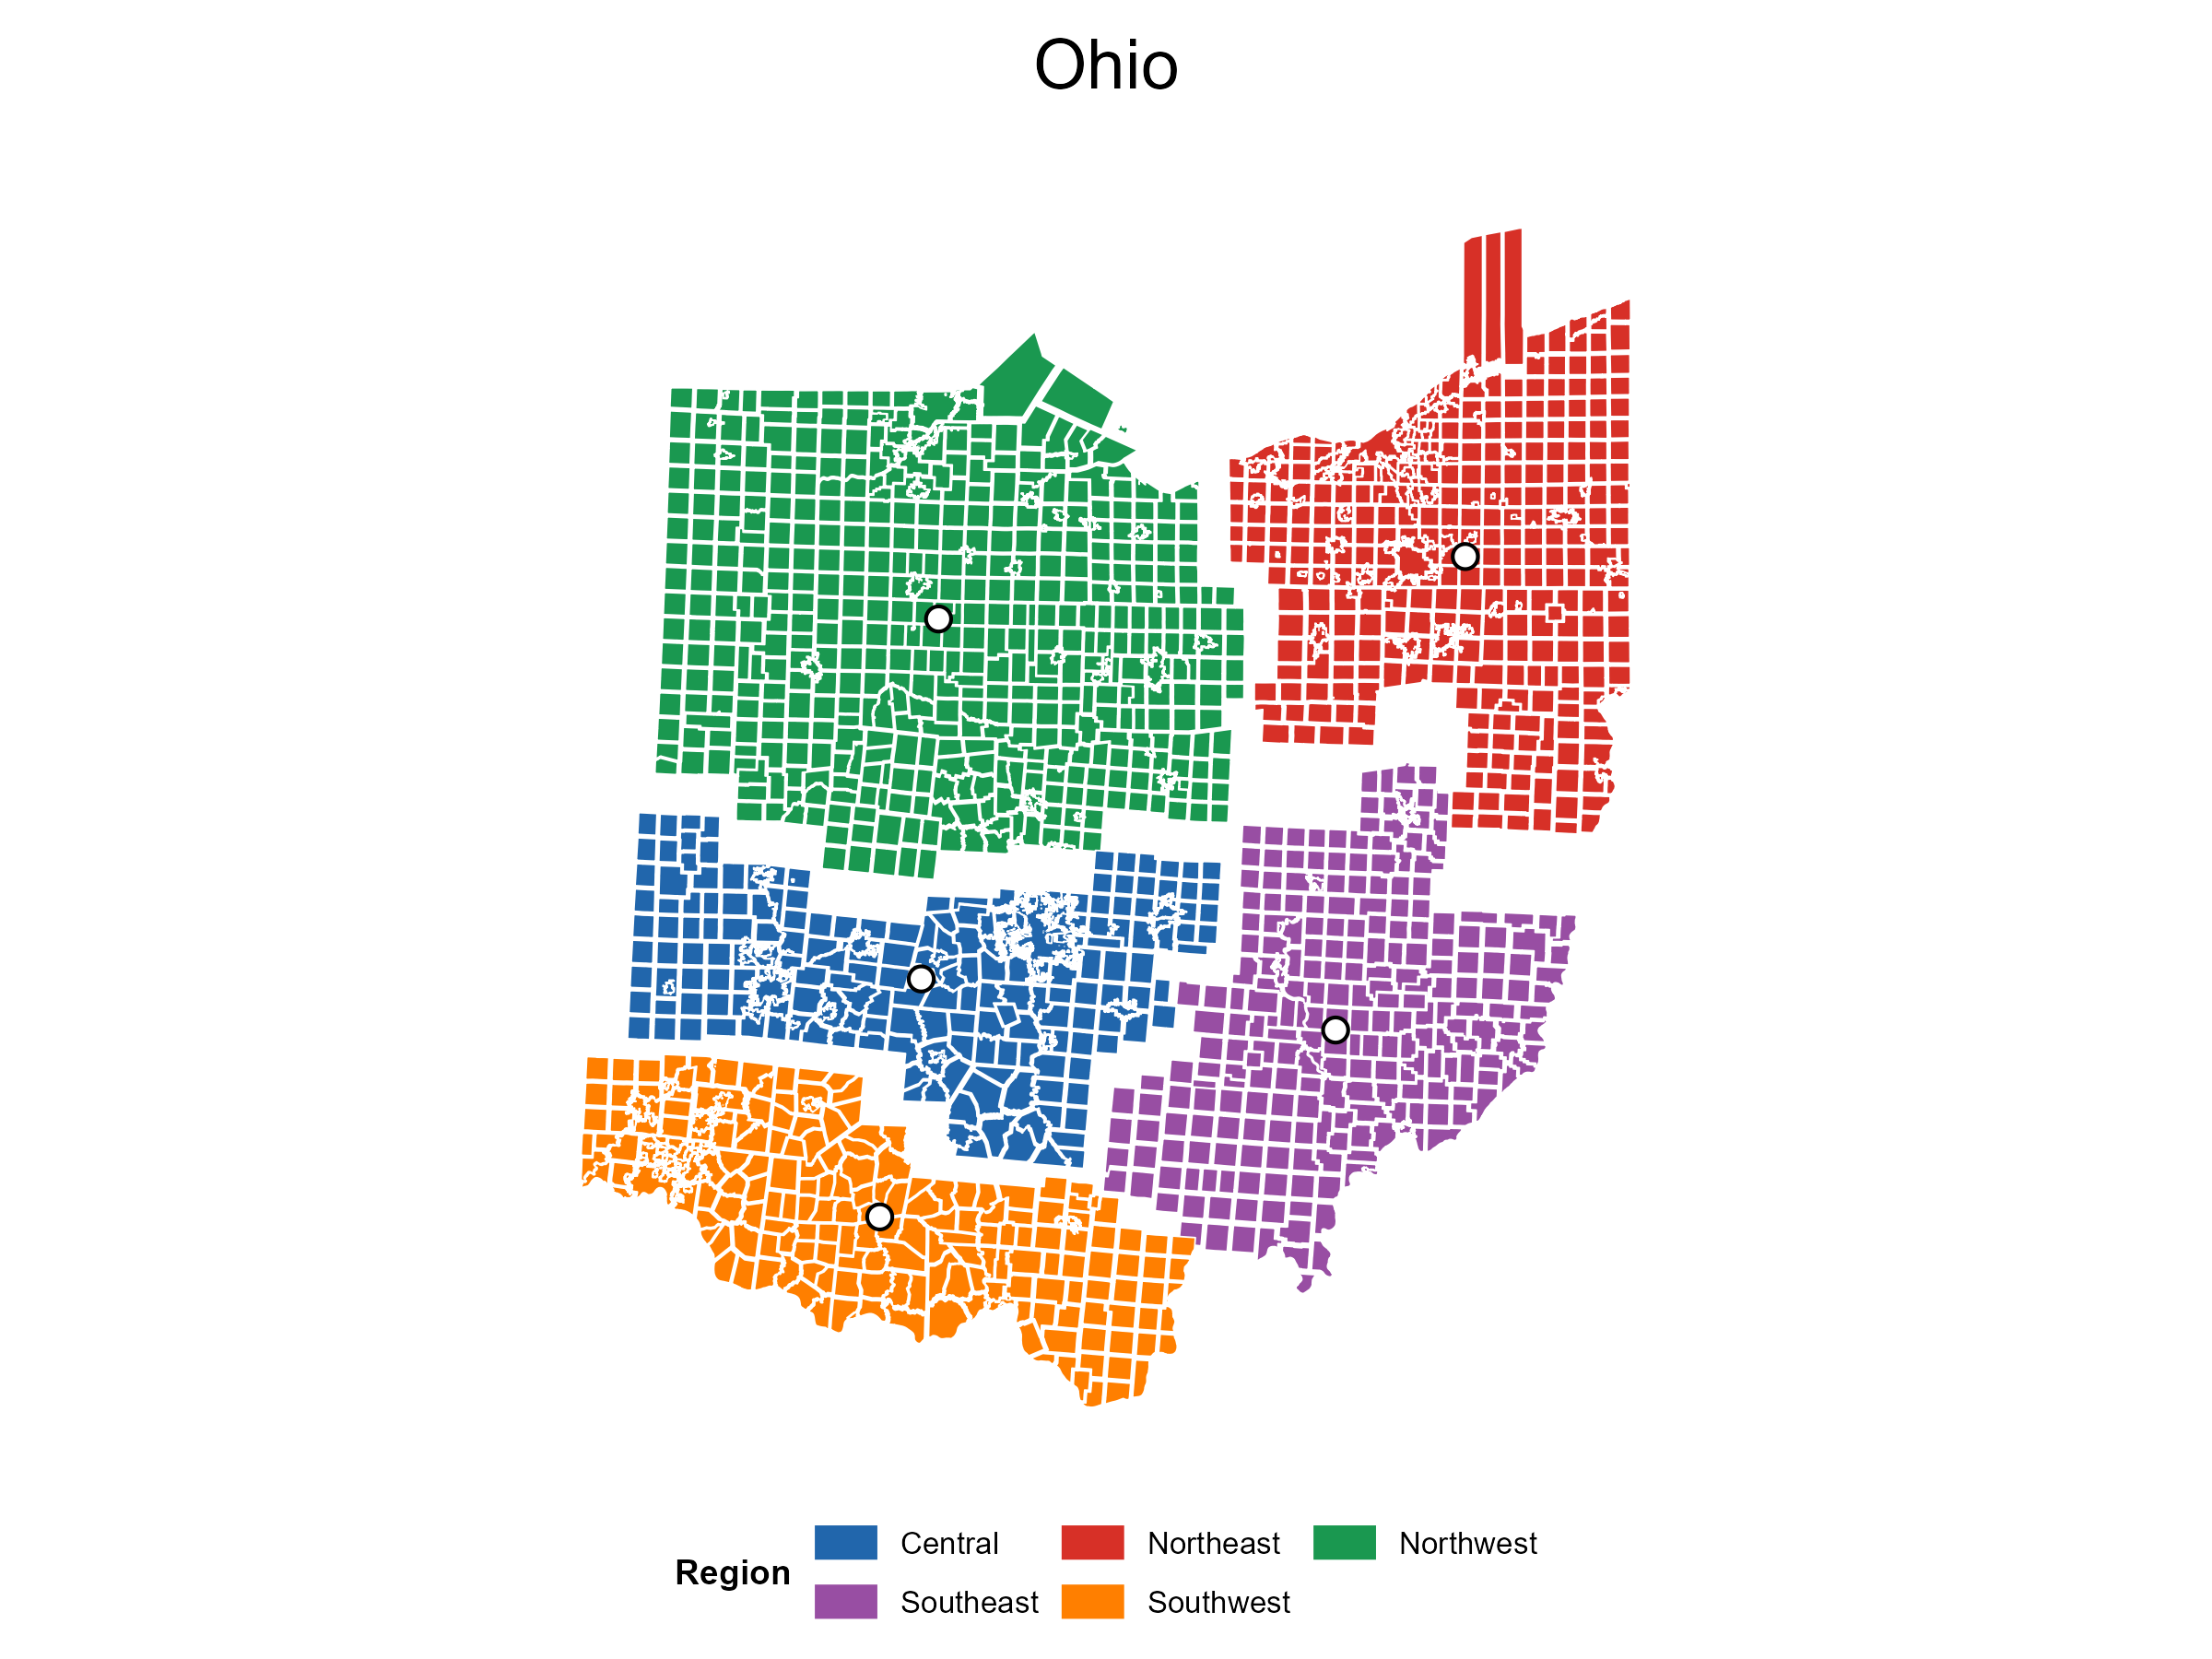
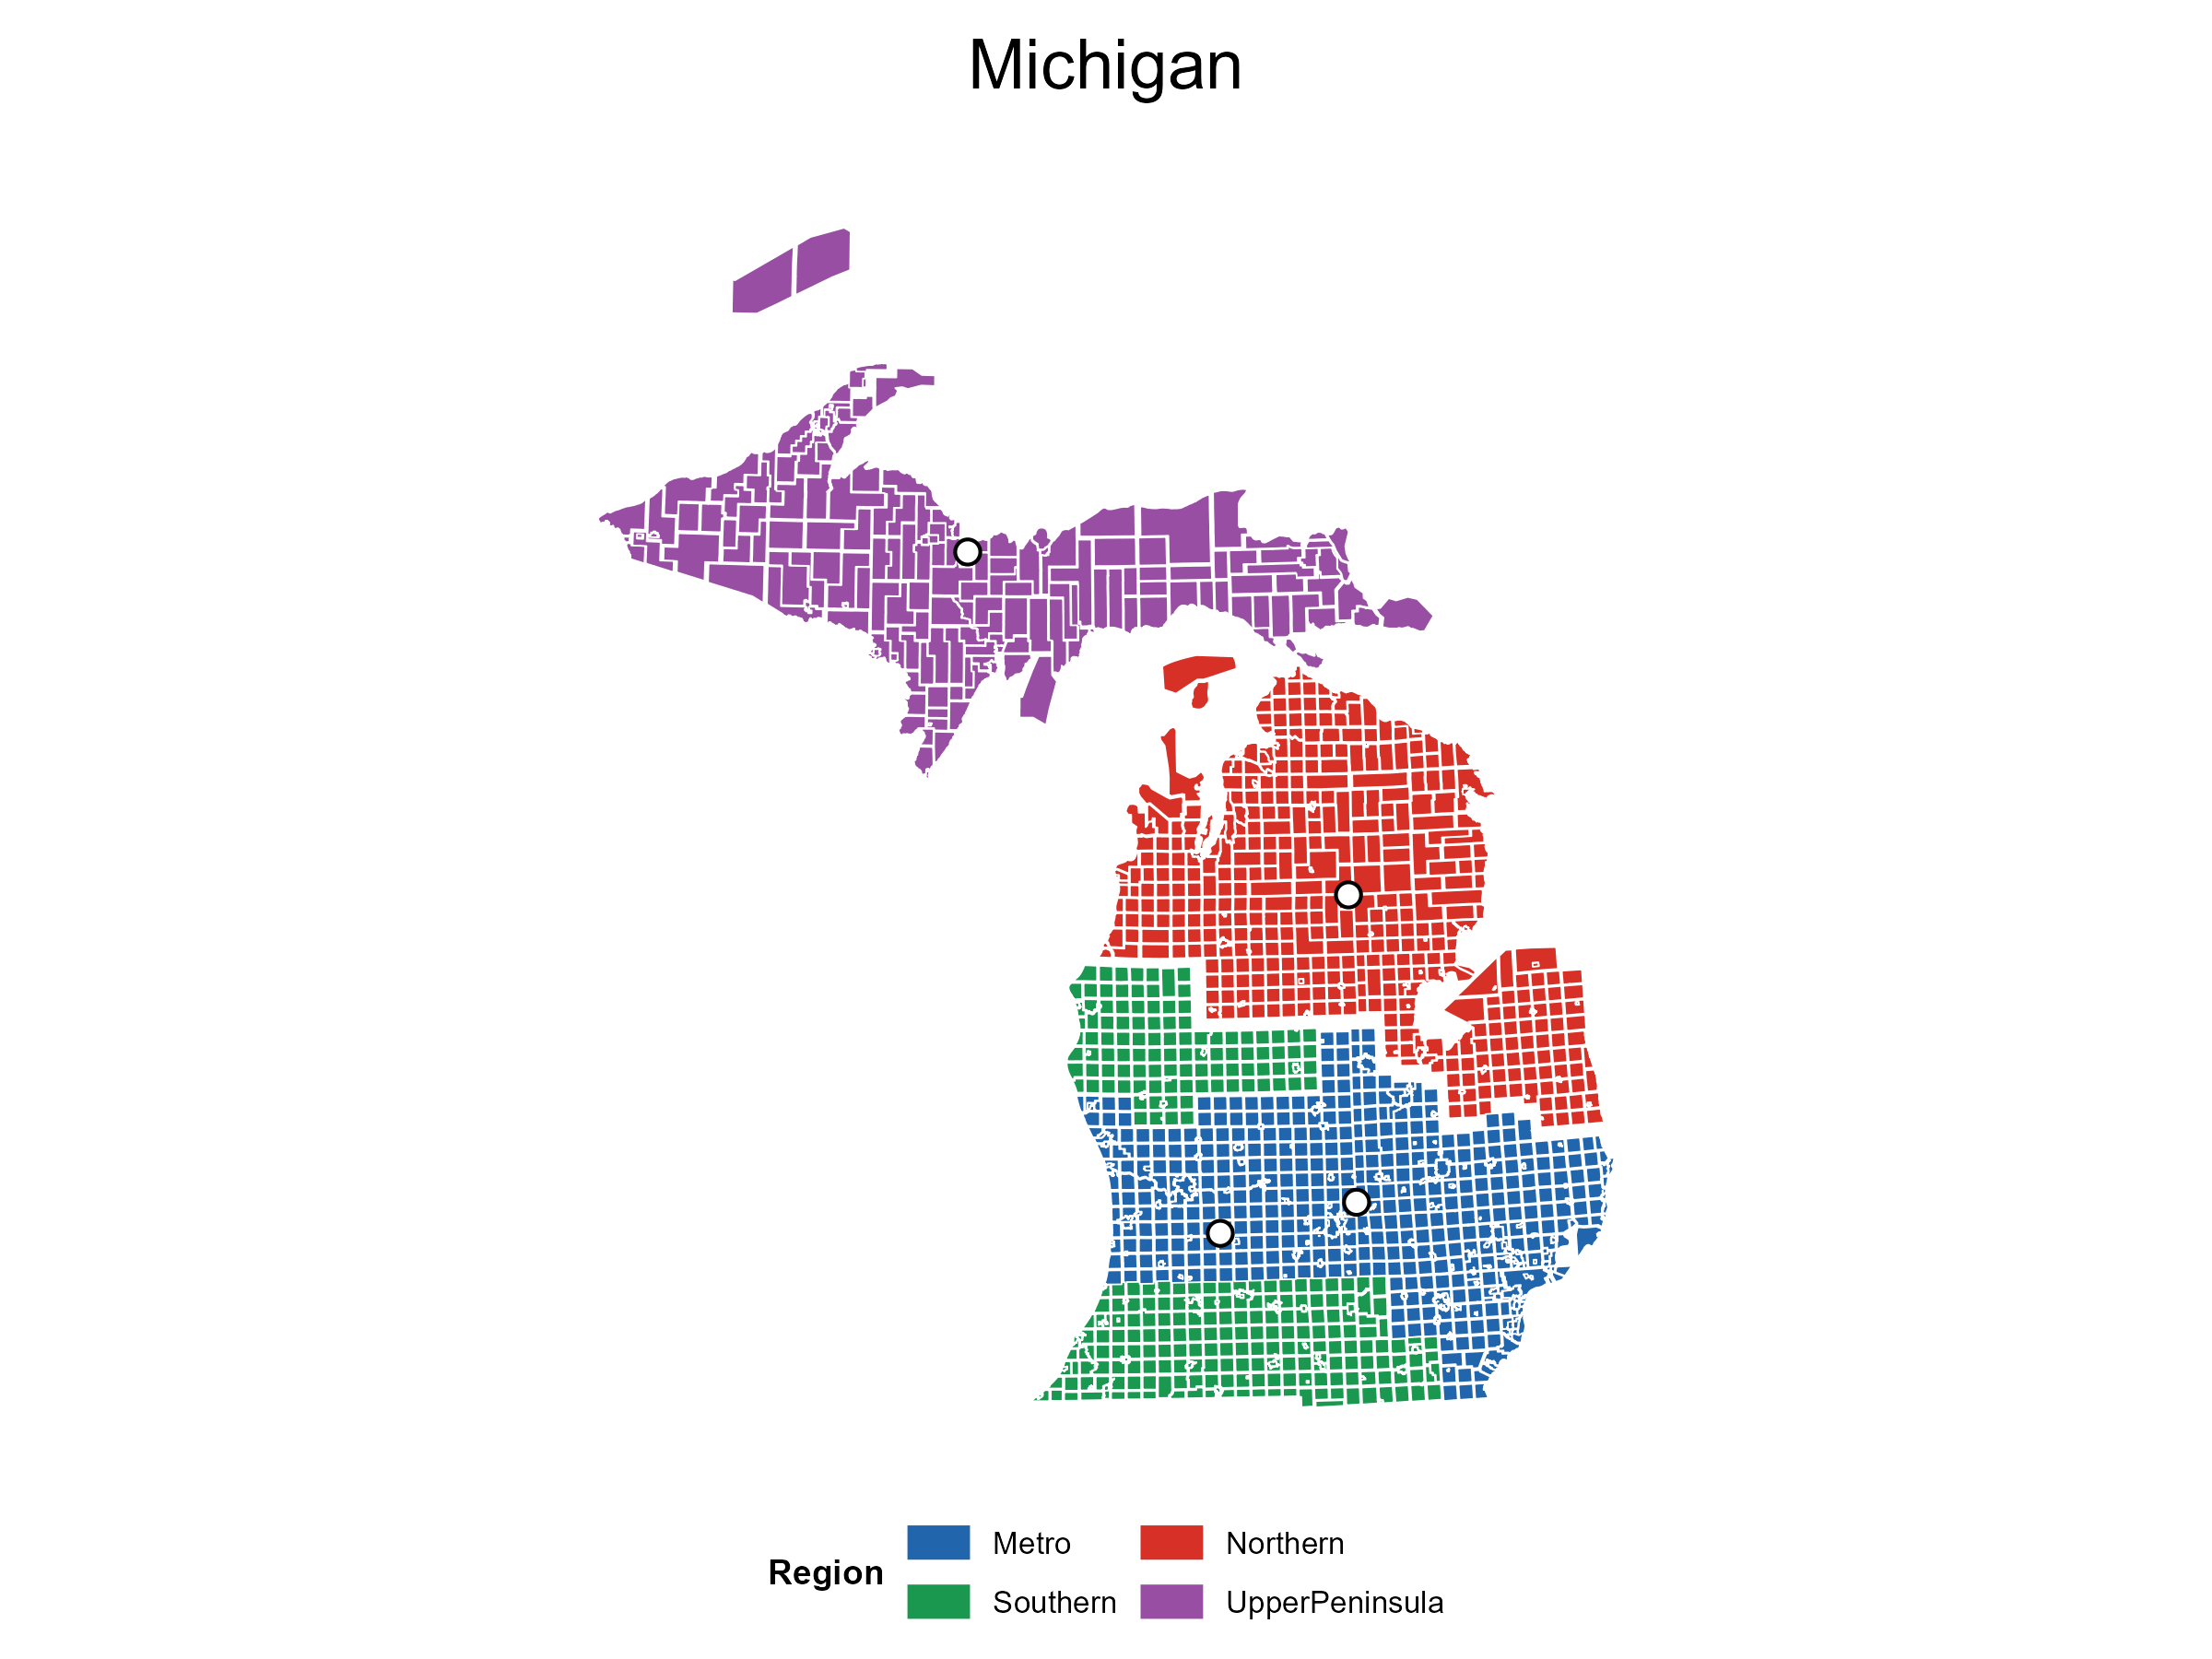
Extended U.S. States
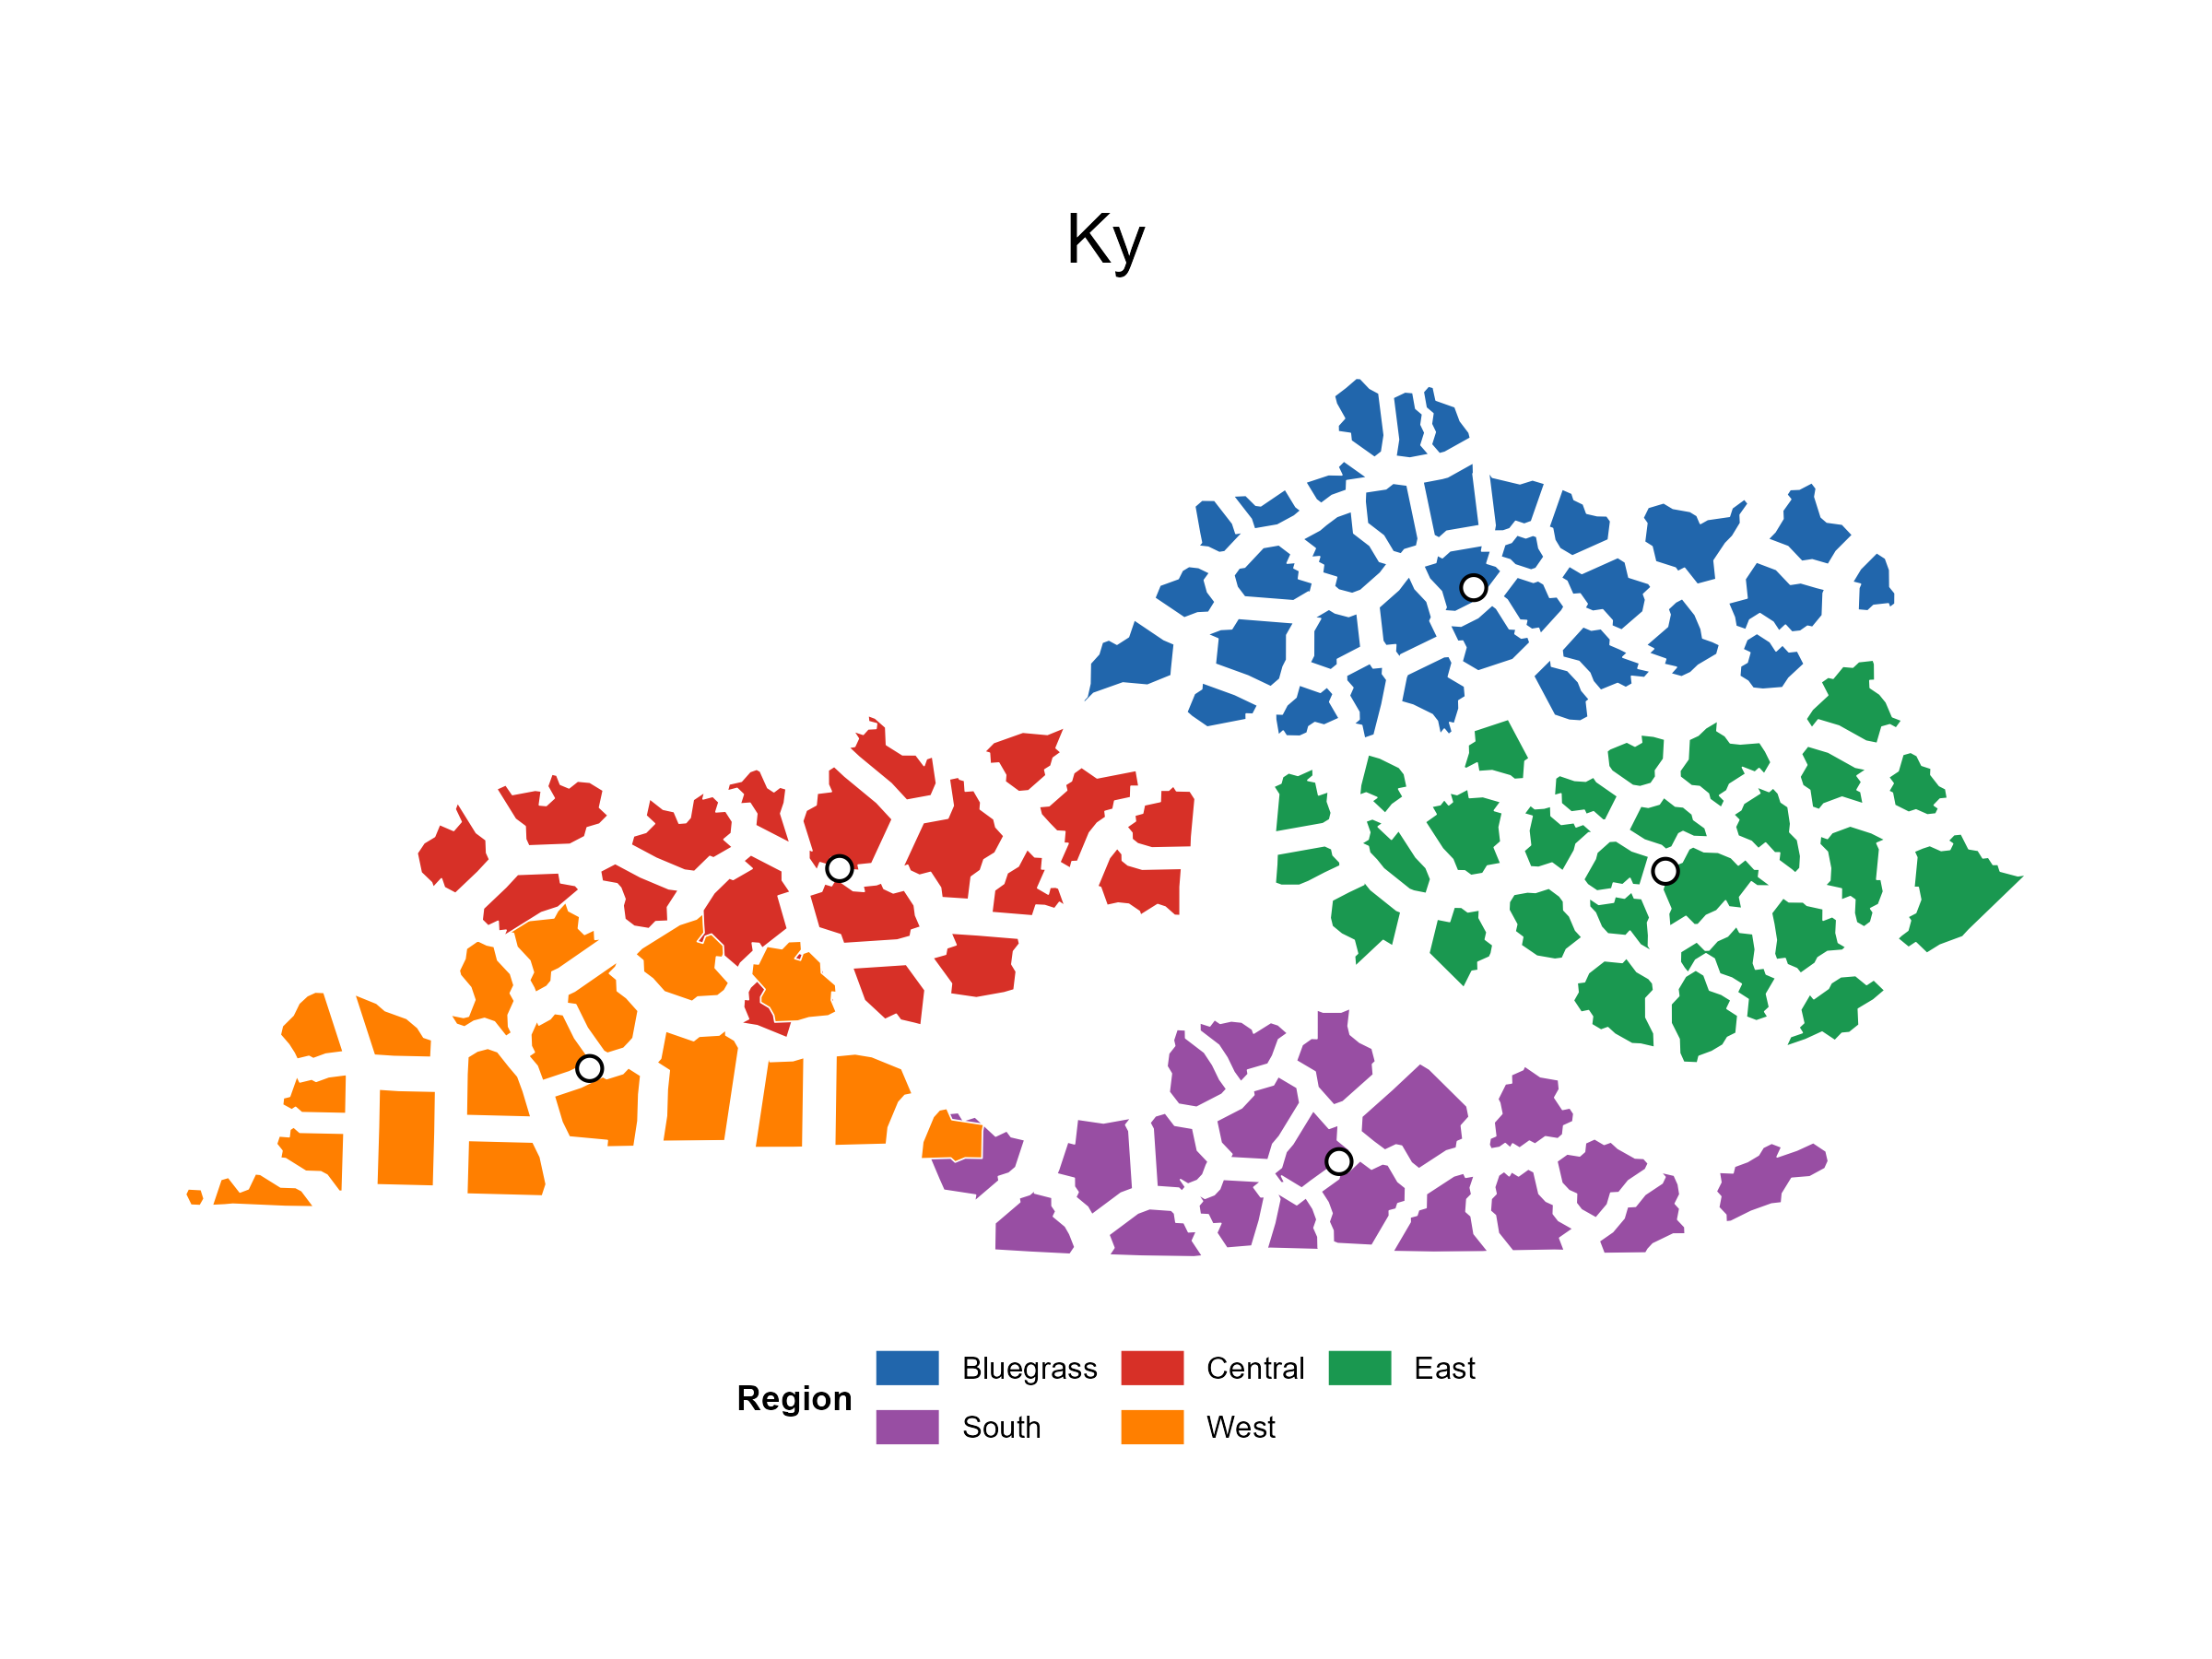
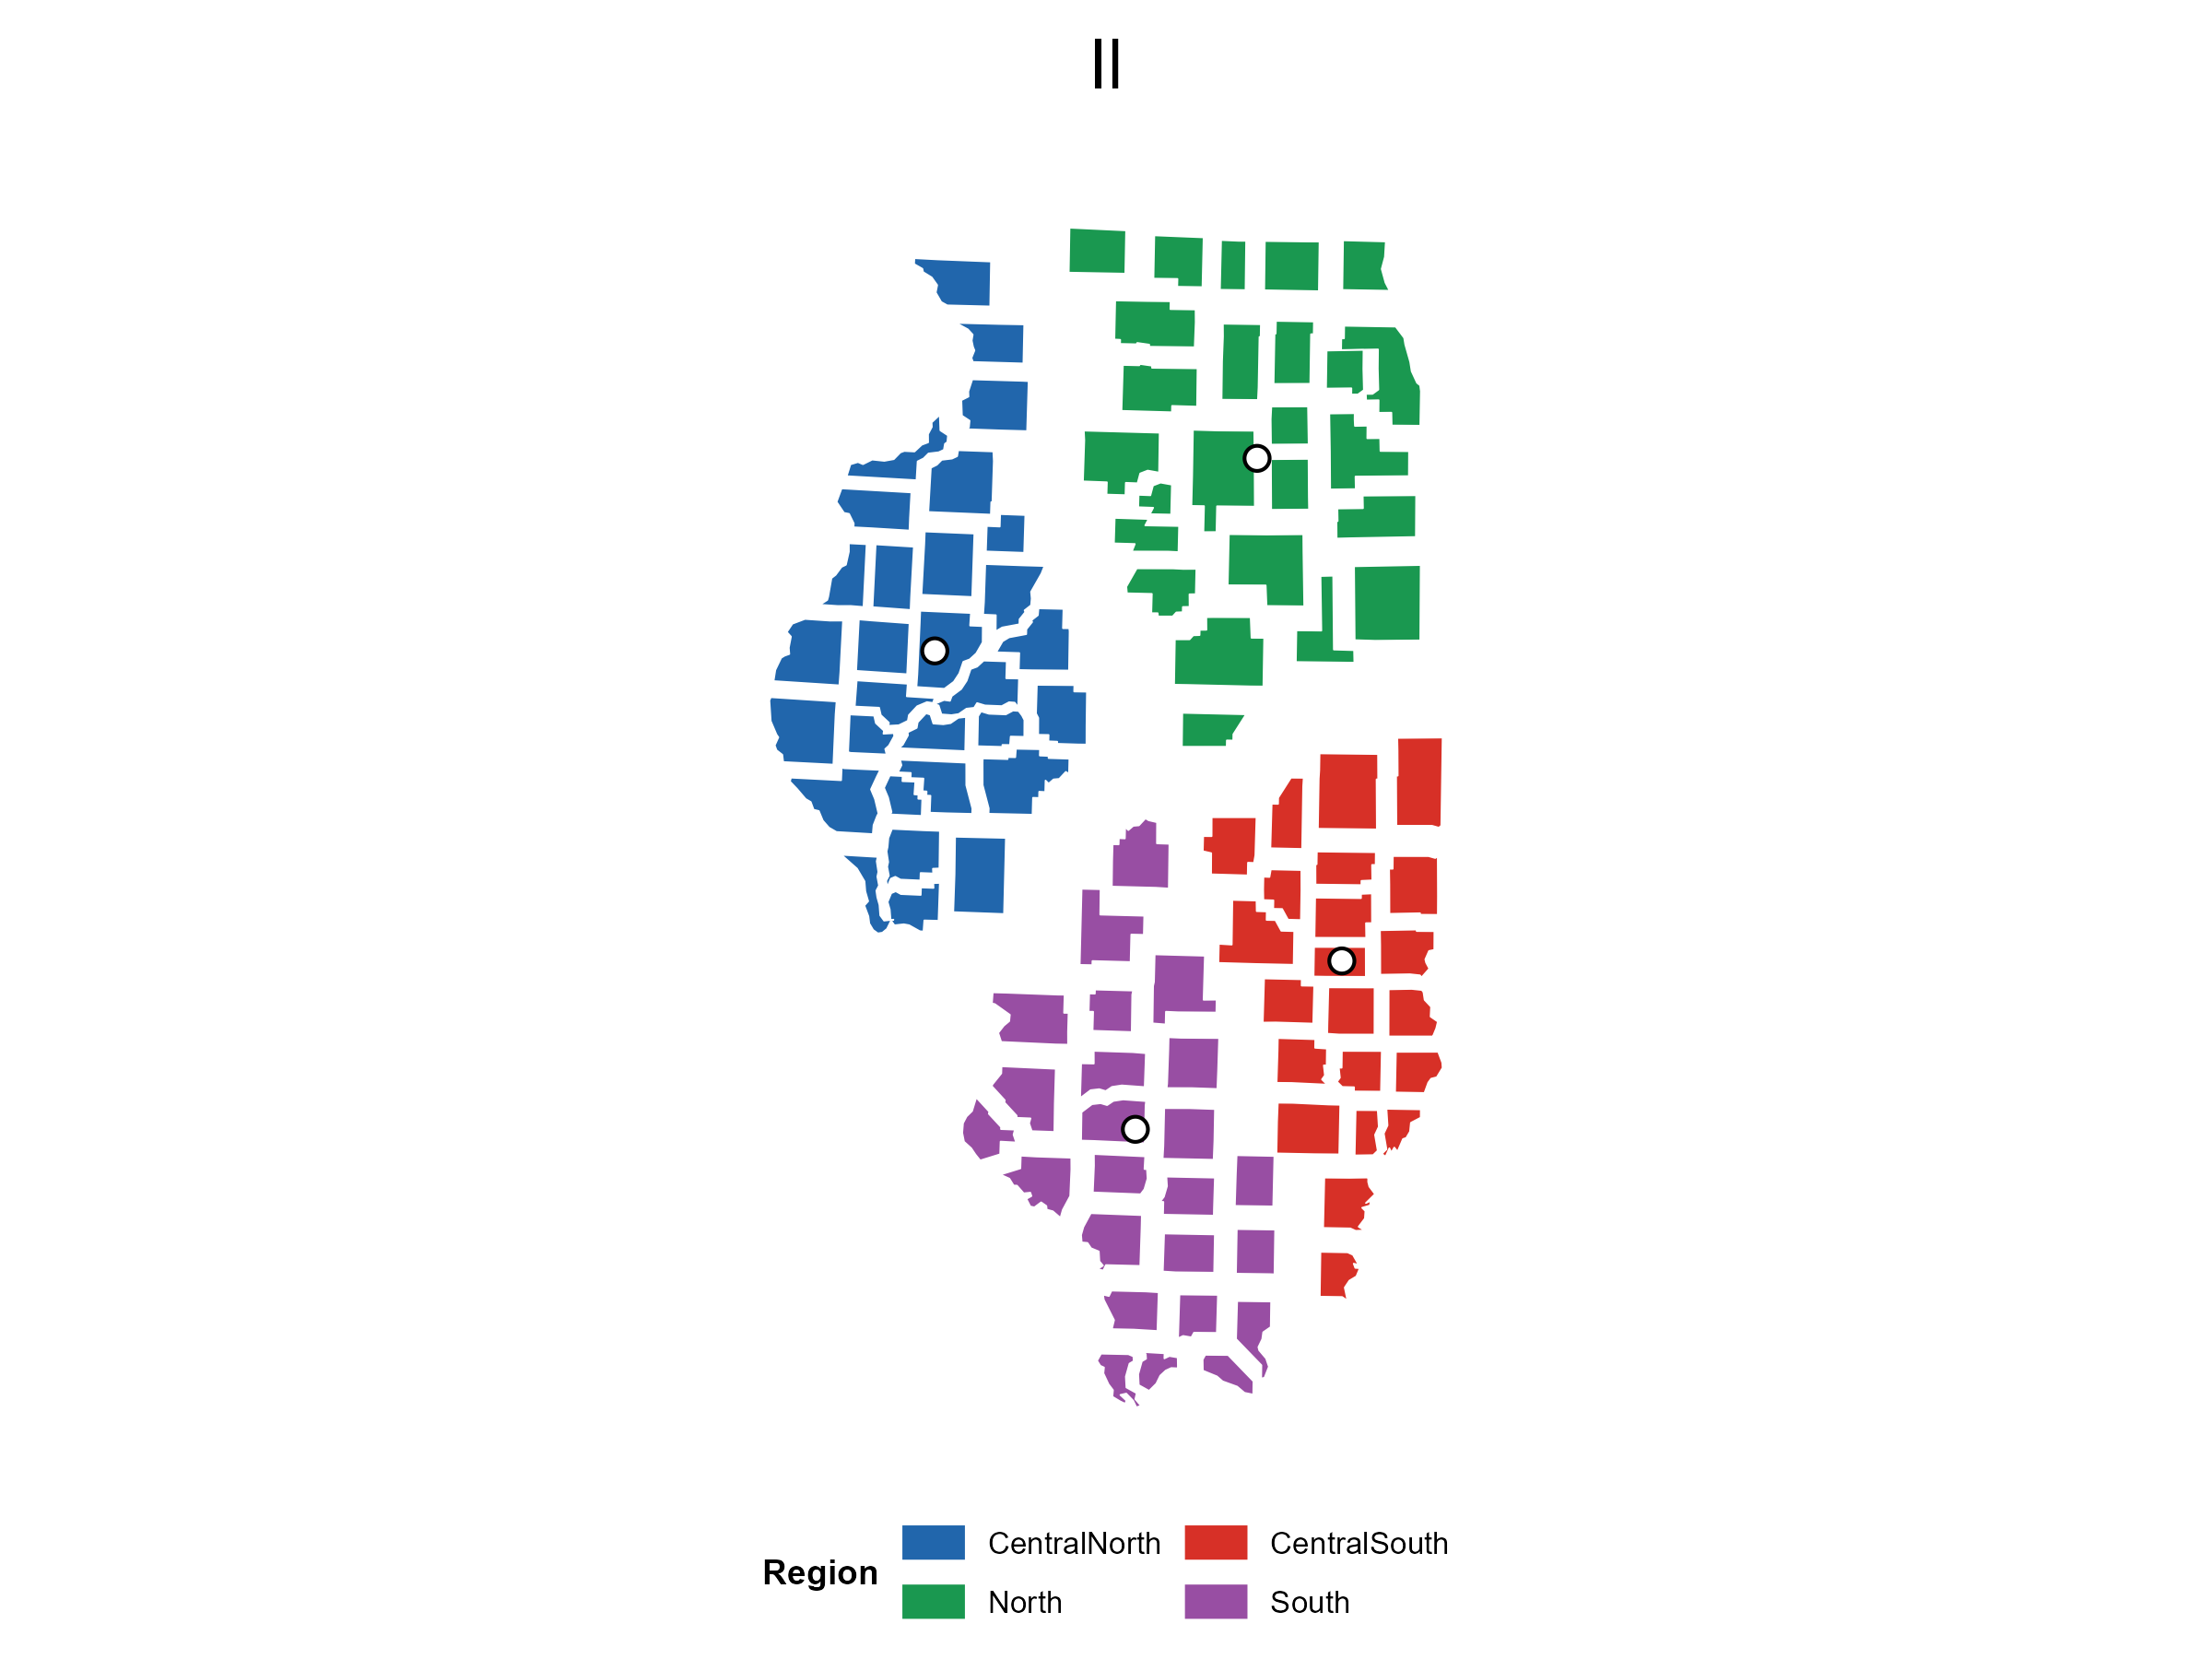
Additional state examples show where the same analytical parameter derivation remains stable and where documented display offsets improve publication readability.
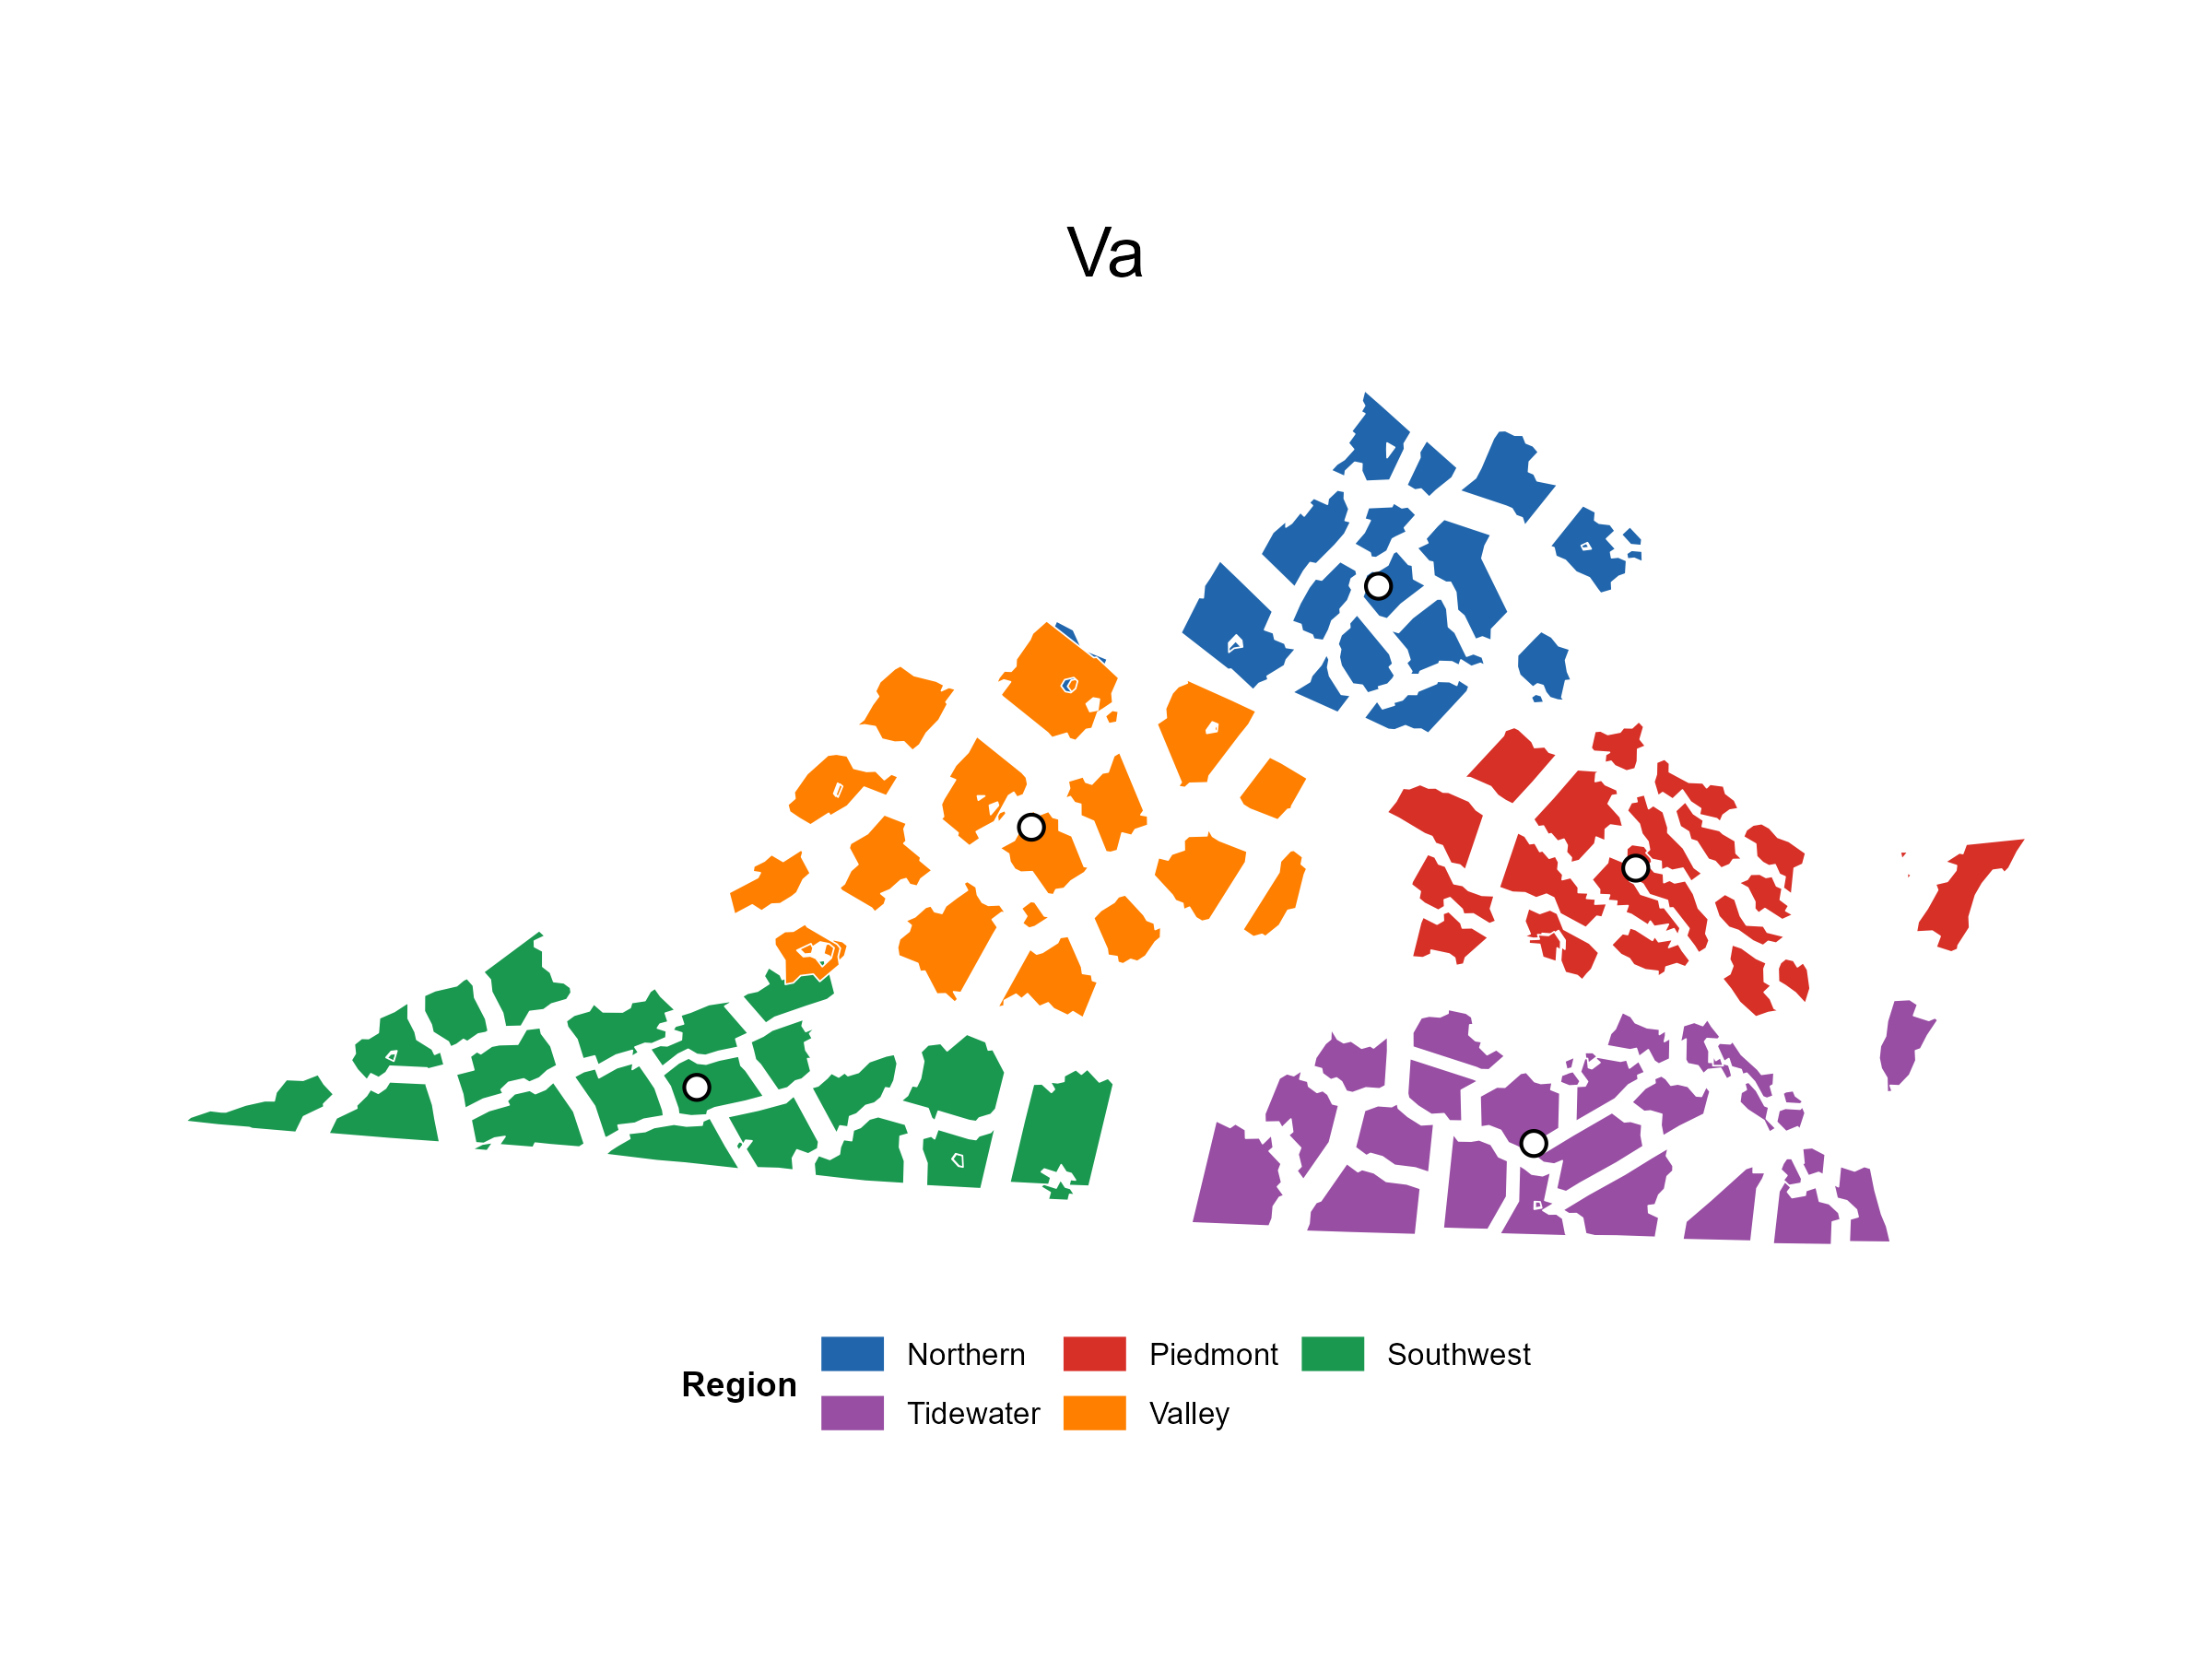
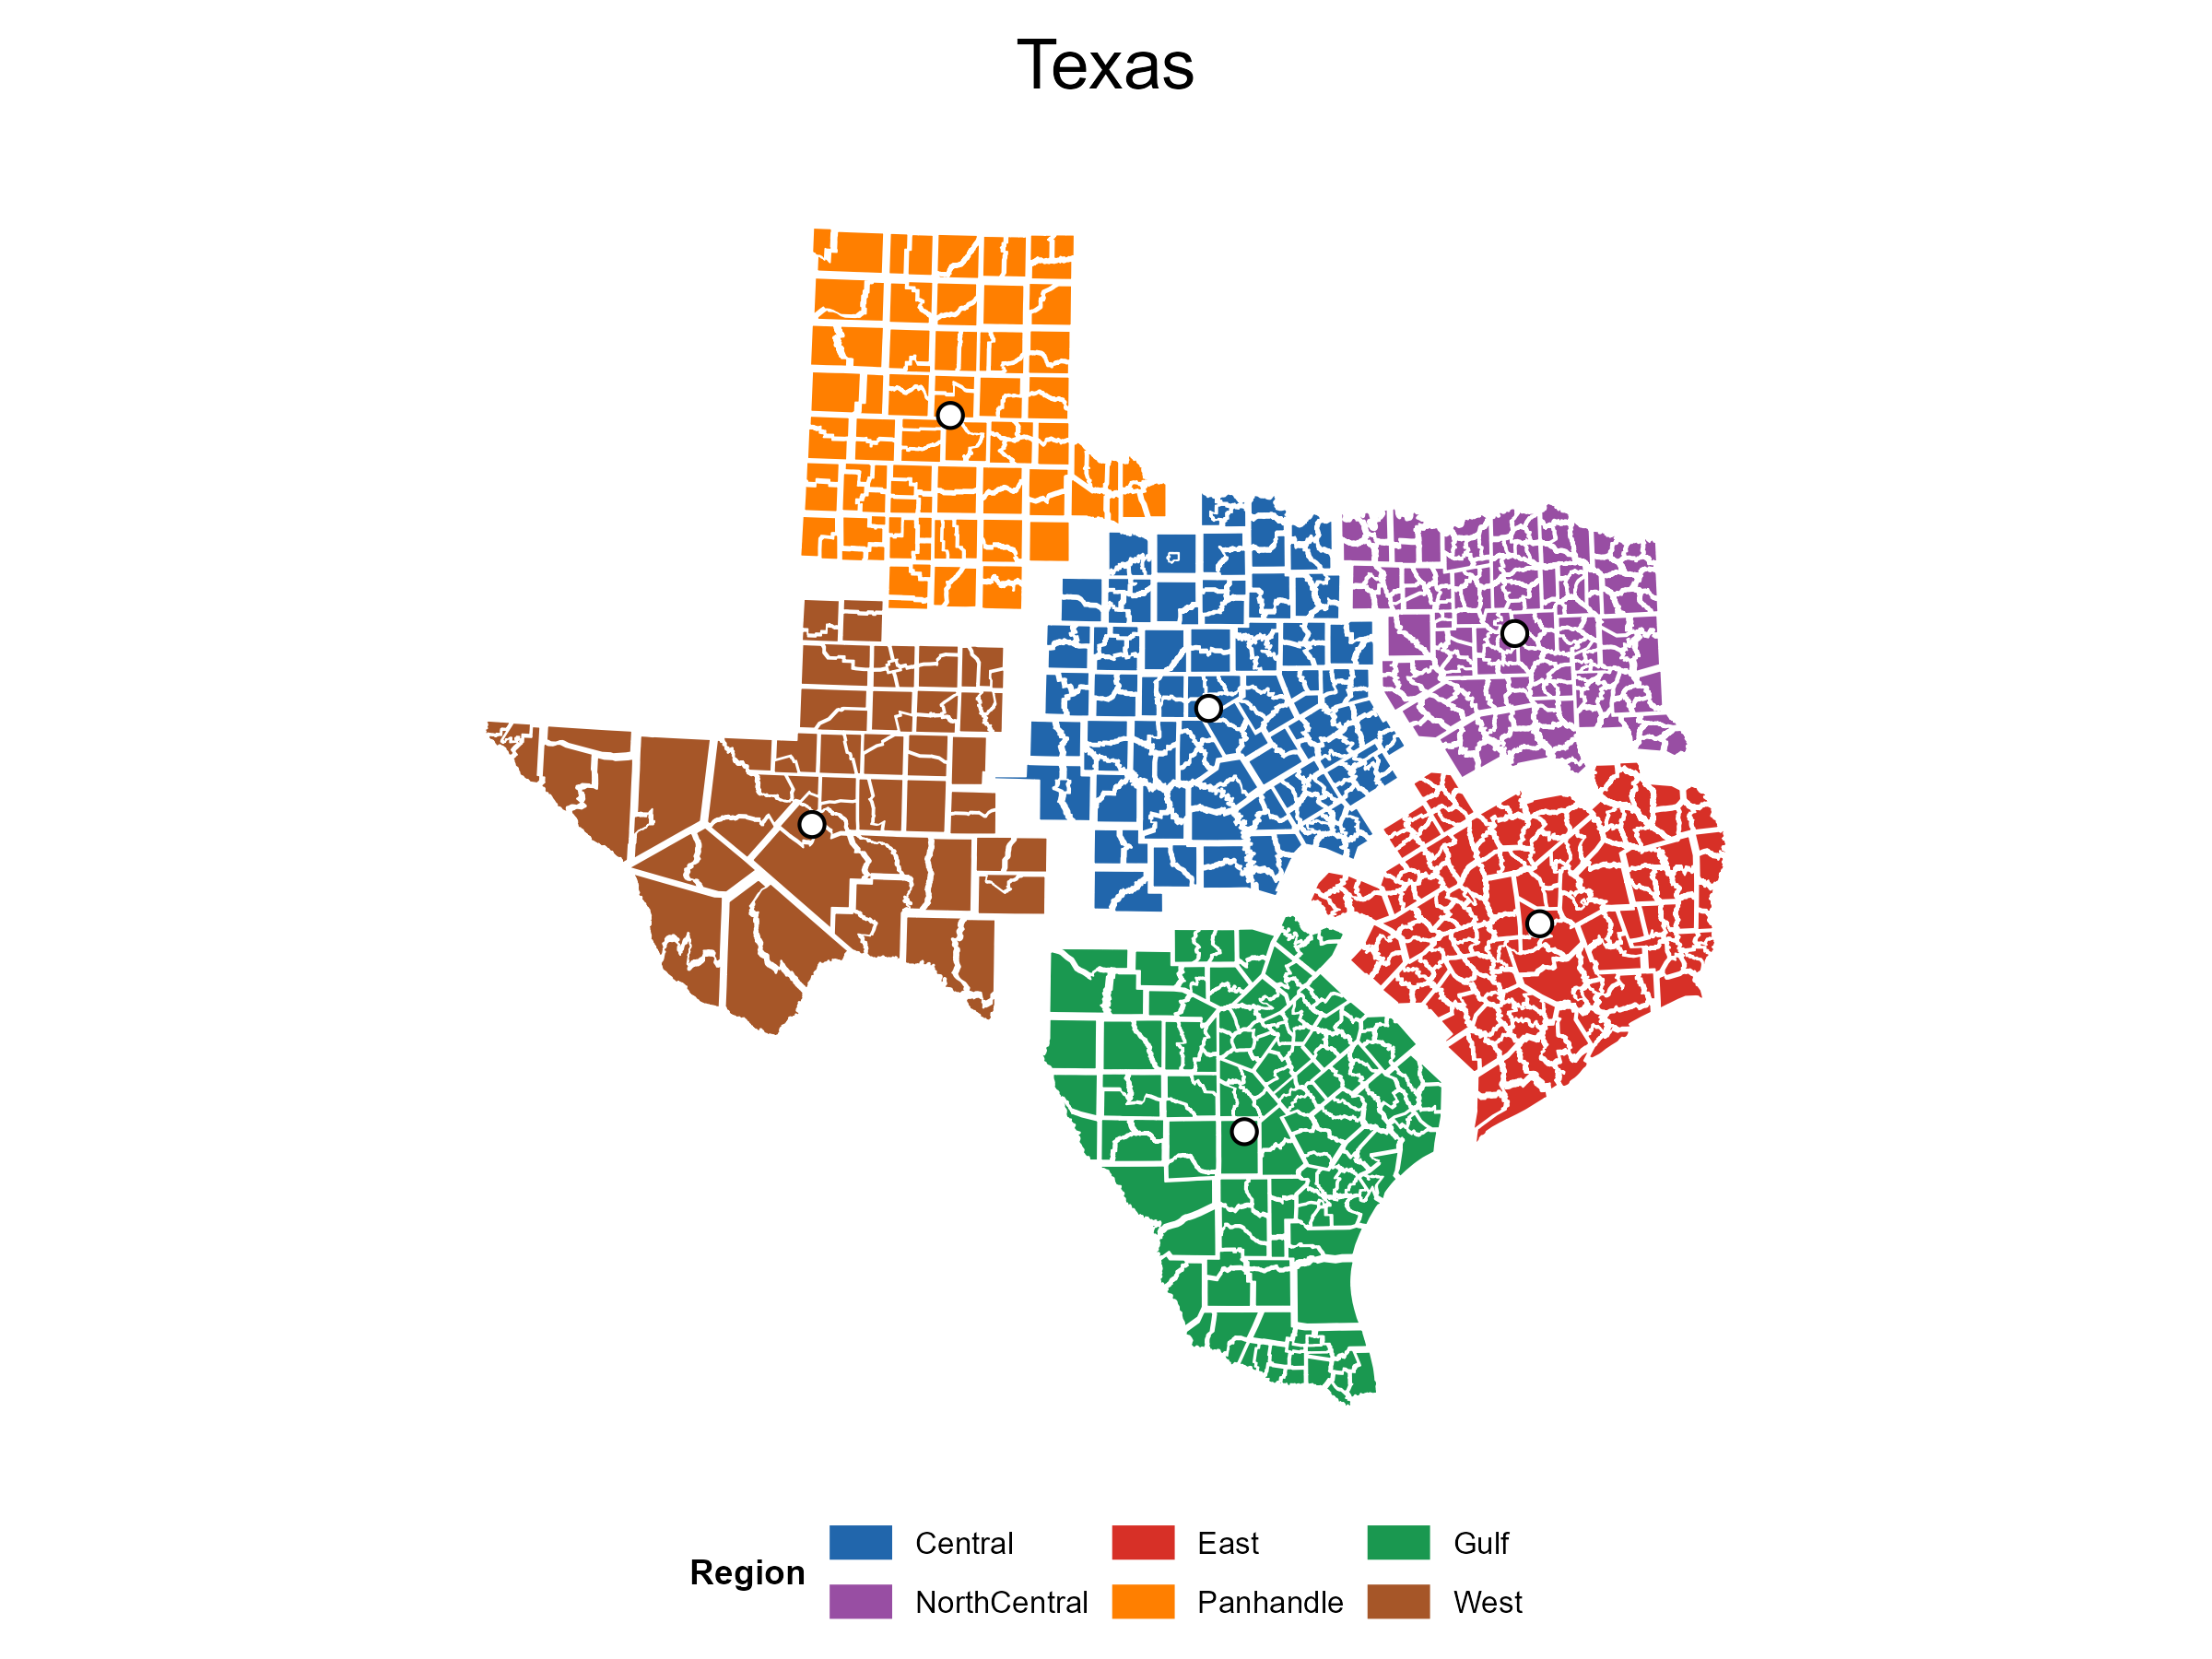
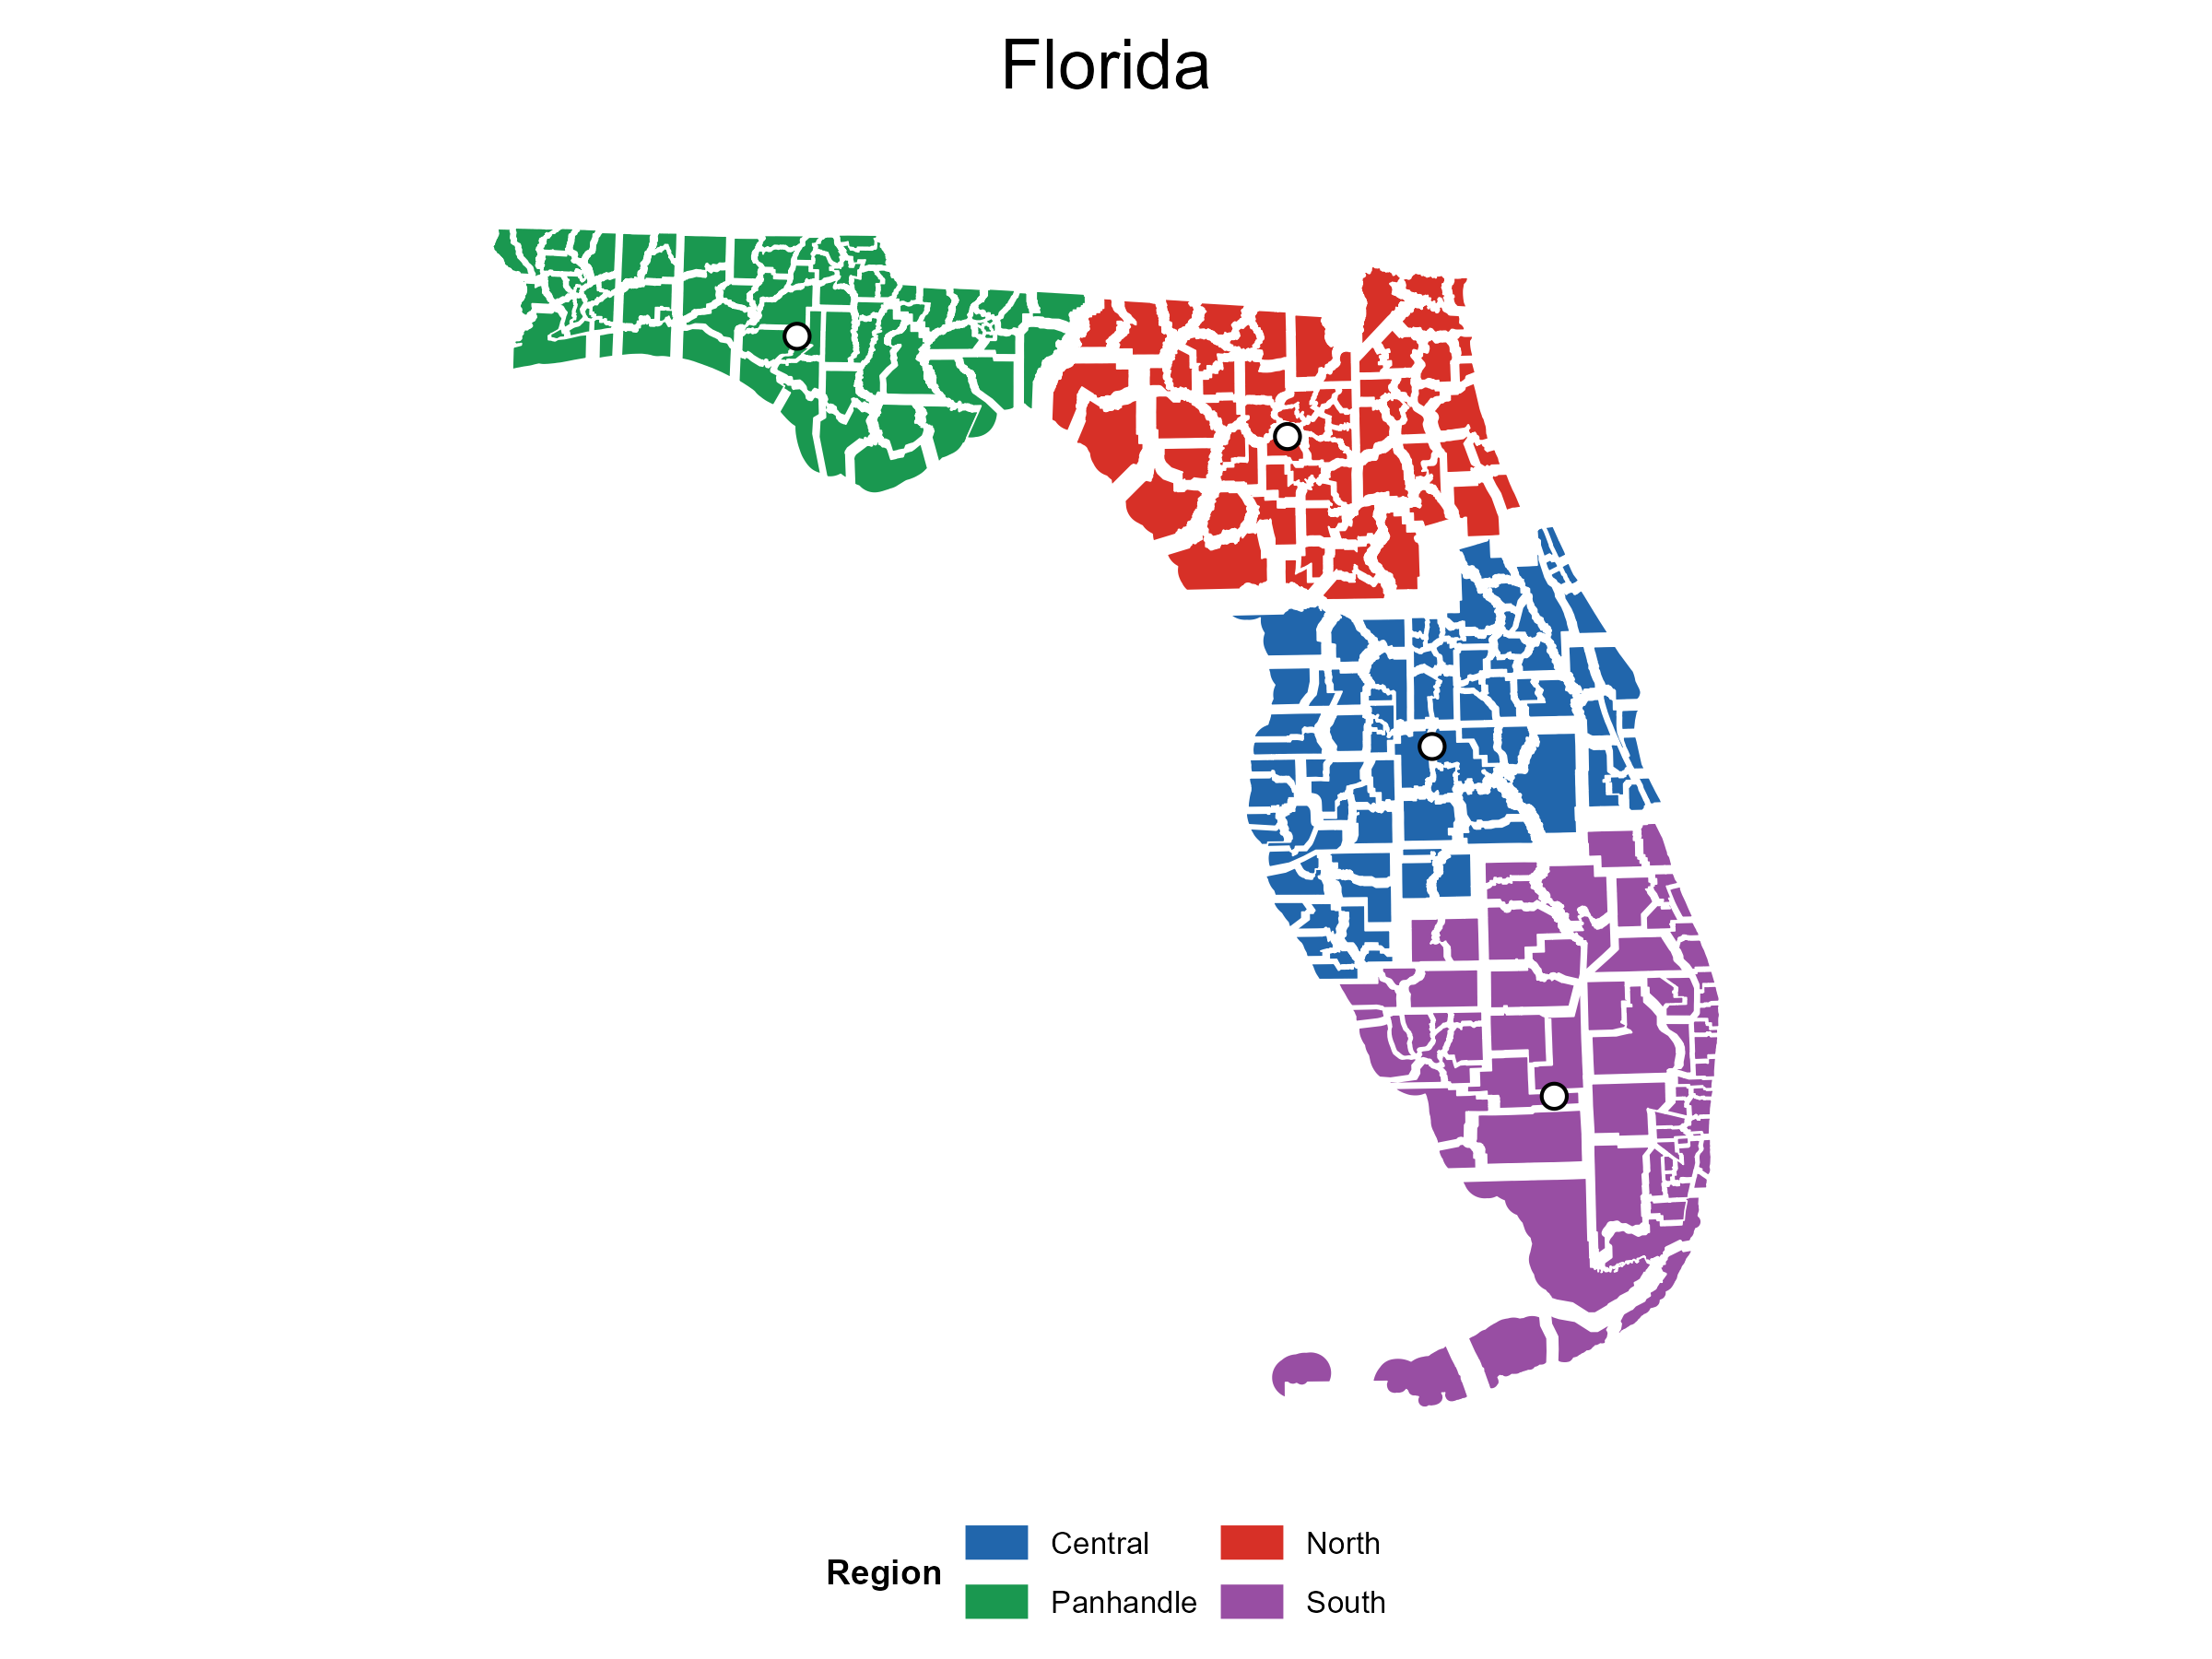
Supplemental County-Level Gallery Layouts
These additional layouts use county-level units rather than county-subdivision units. They are included as visual demonstrations of the same display-offset workflow, not as tightness-ratio calibration cases.
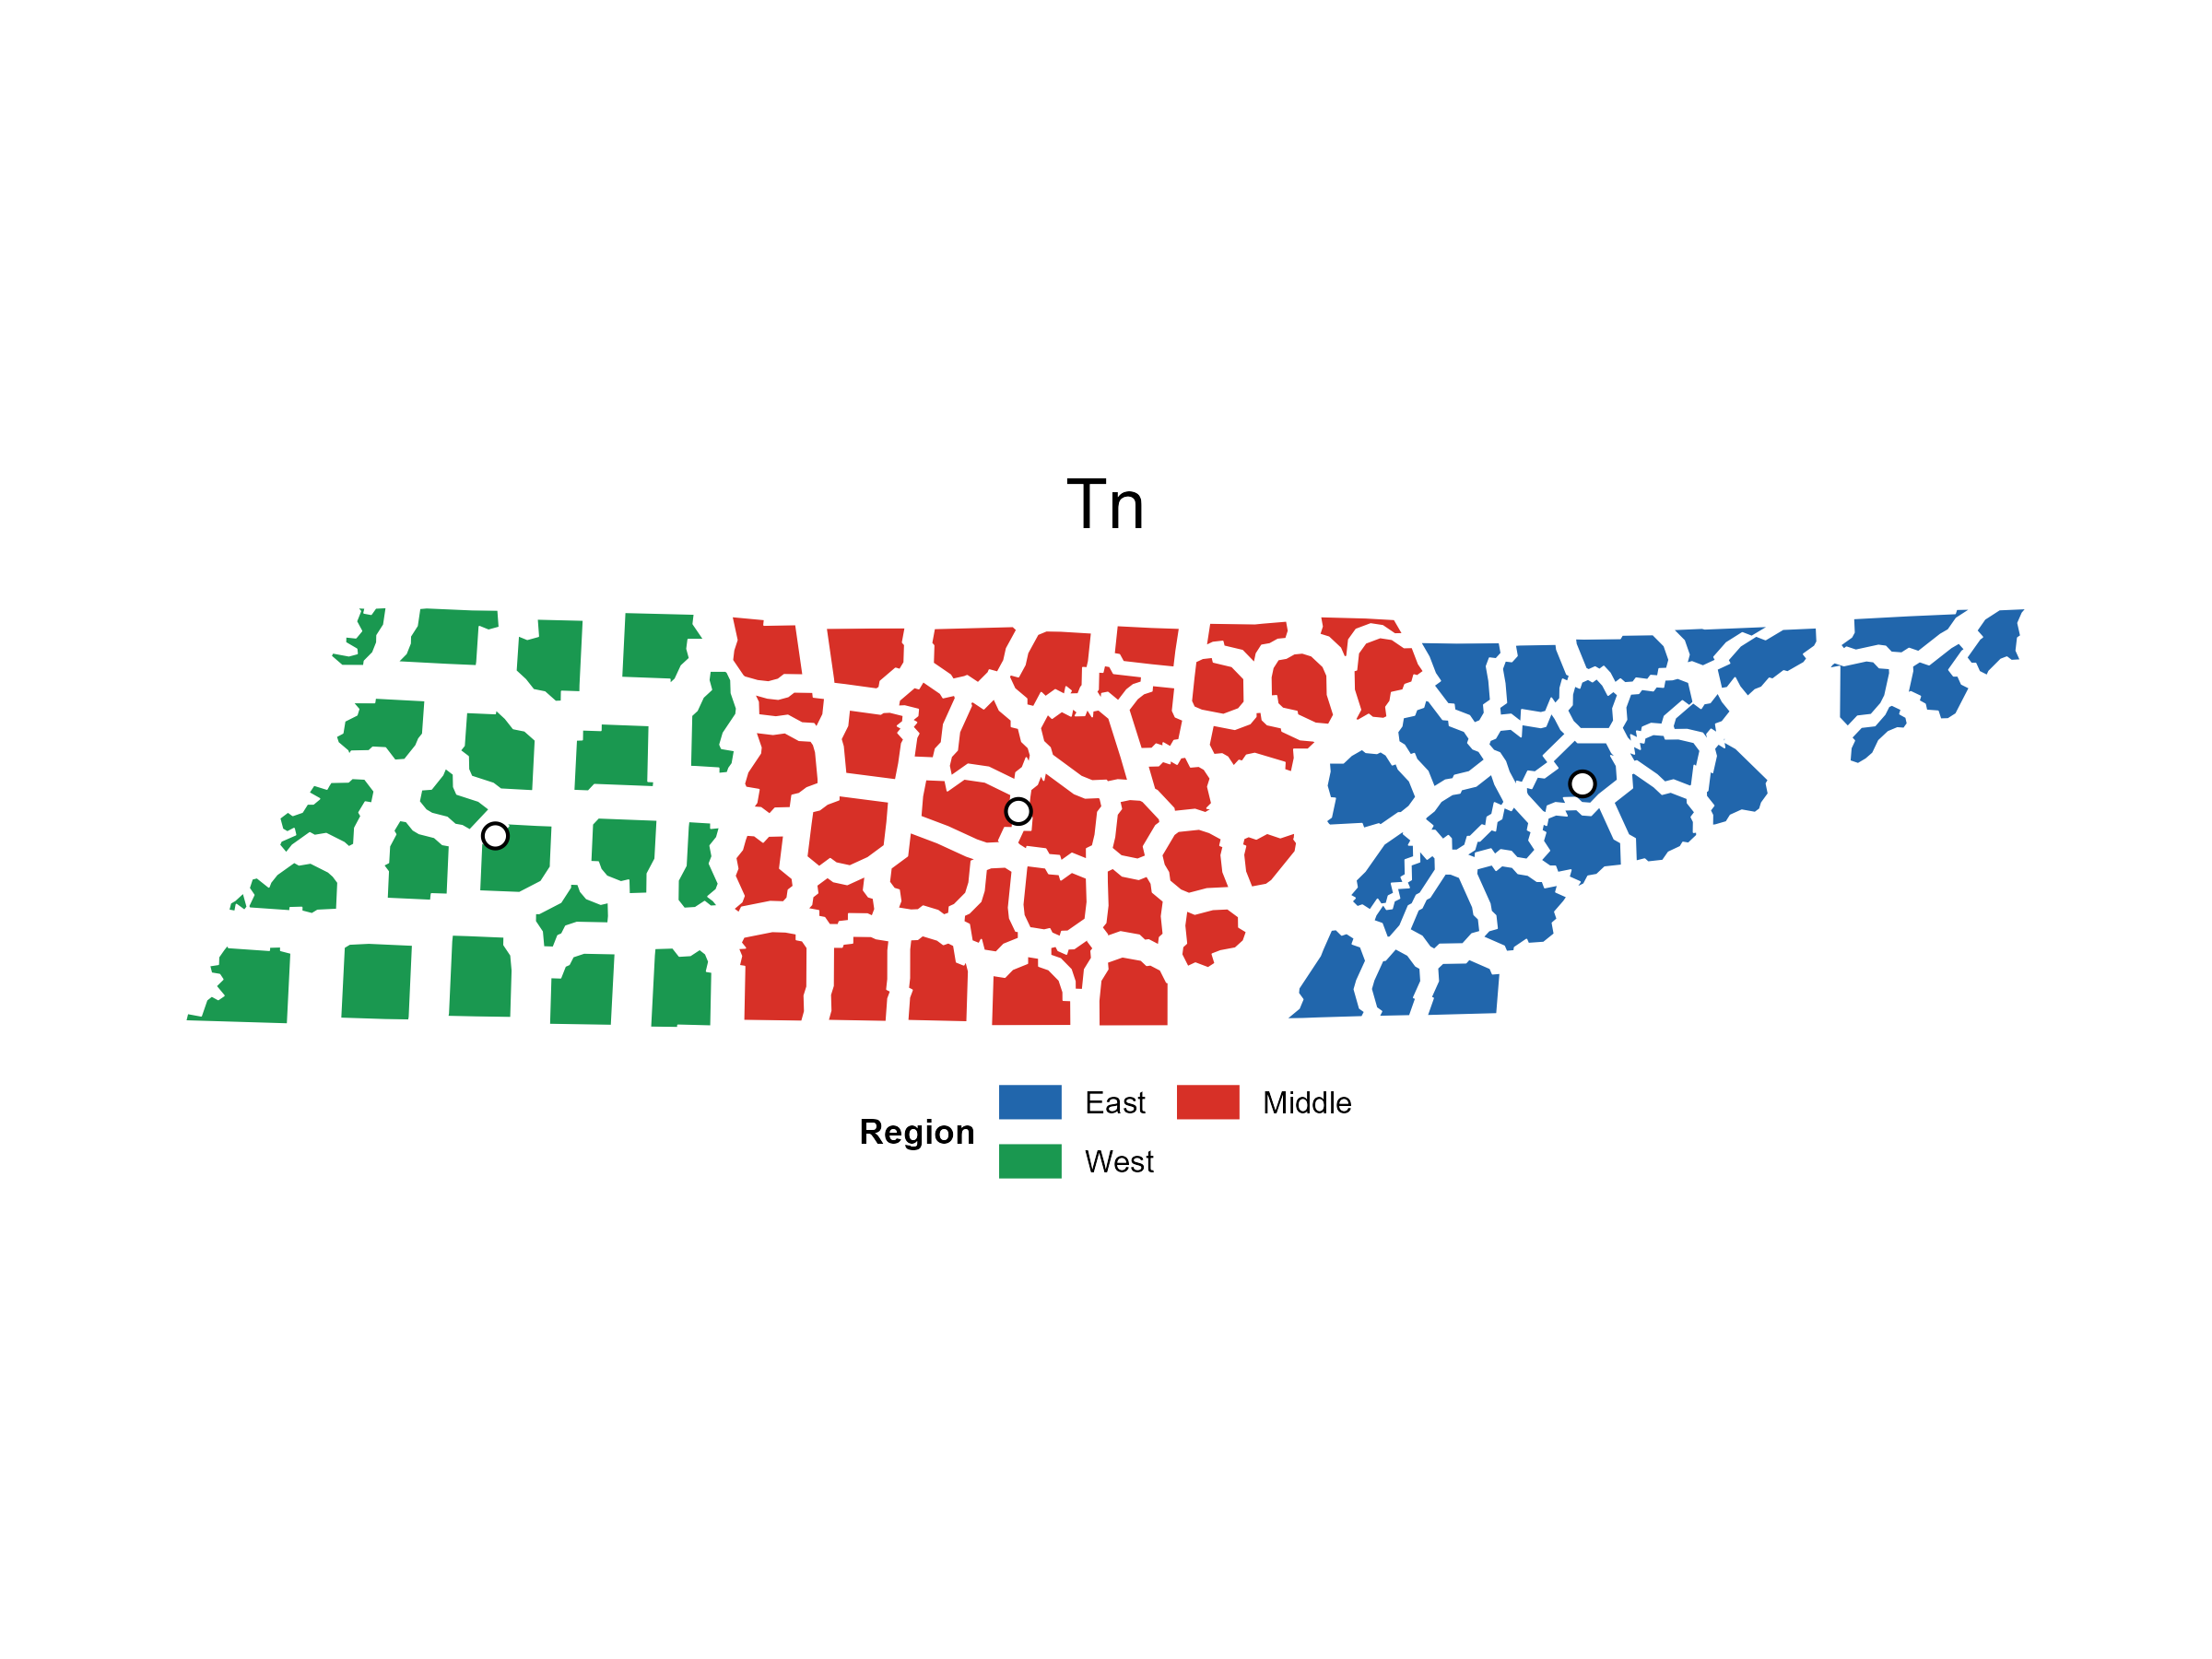
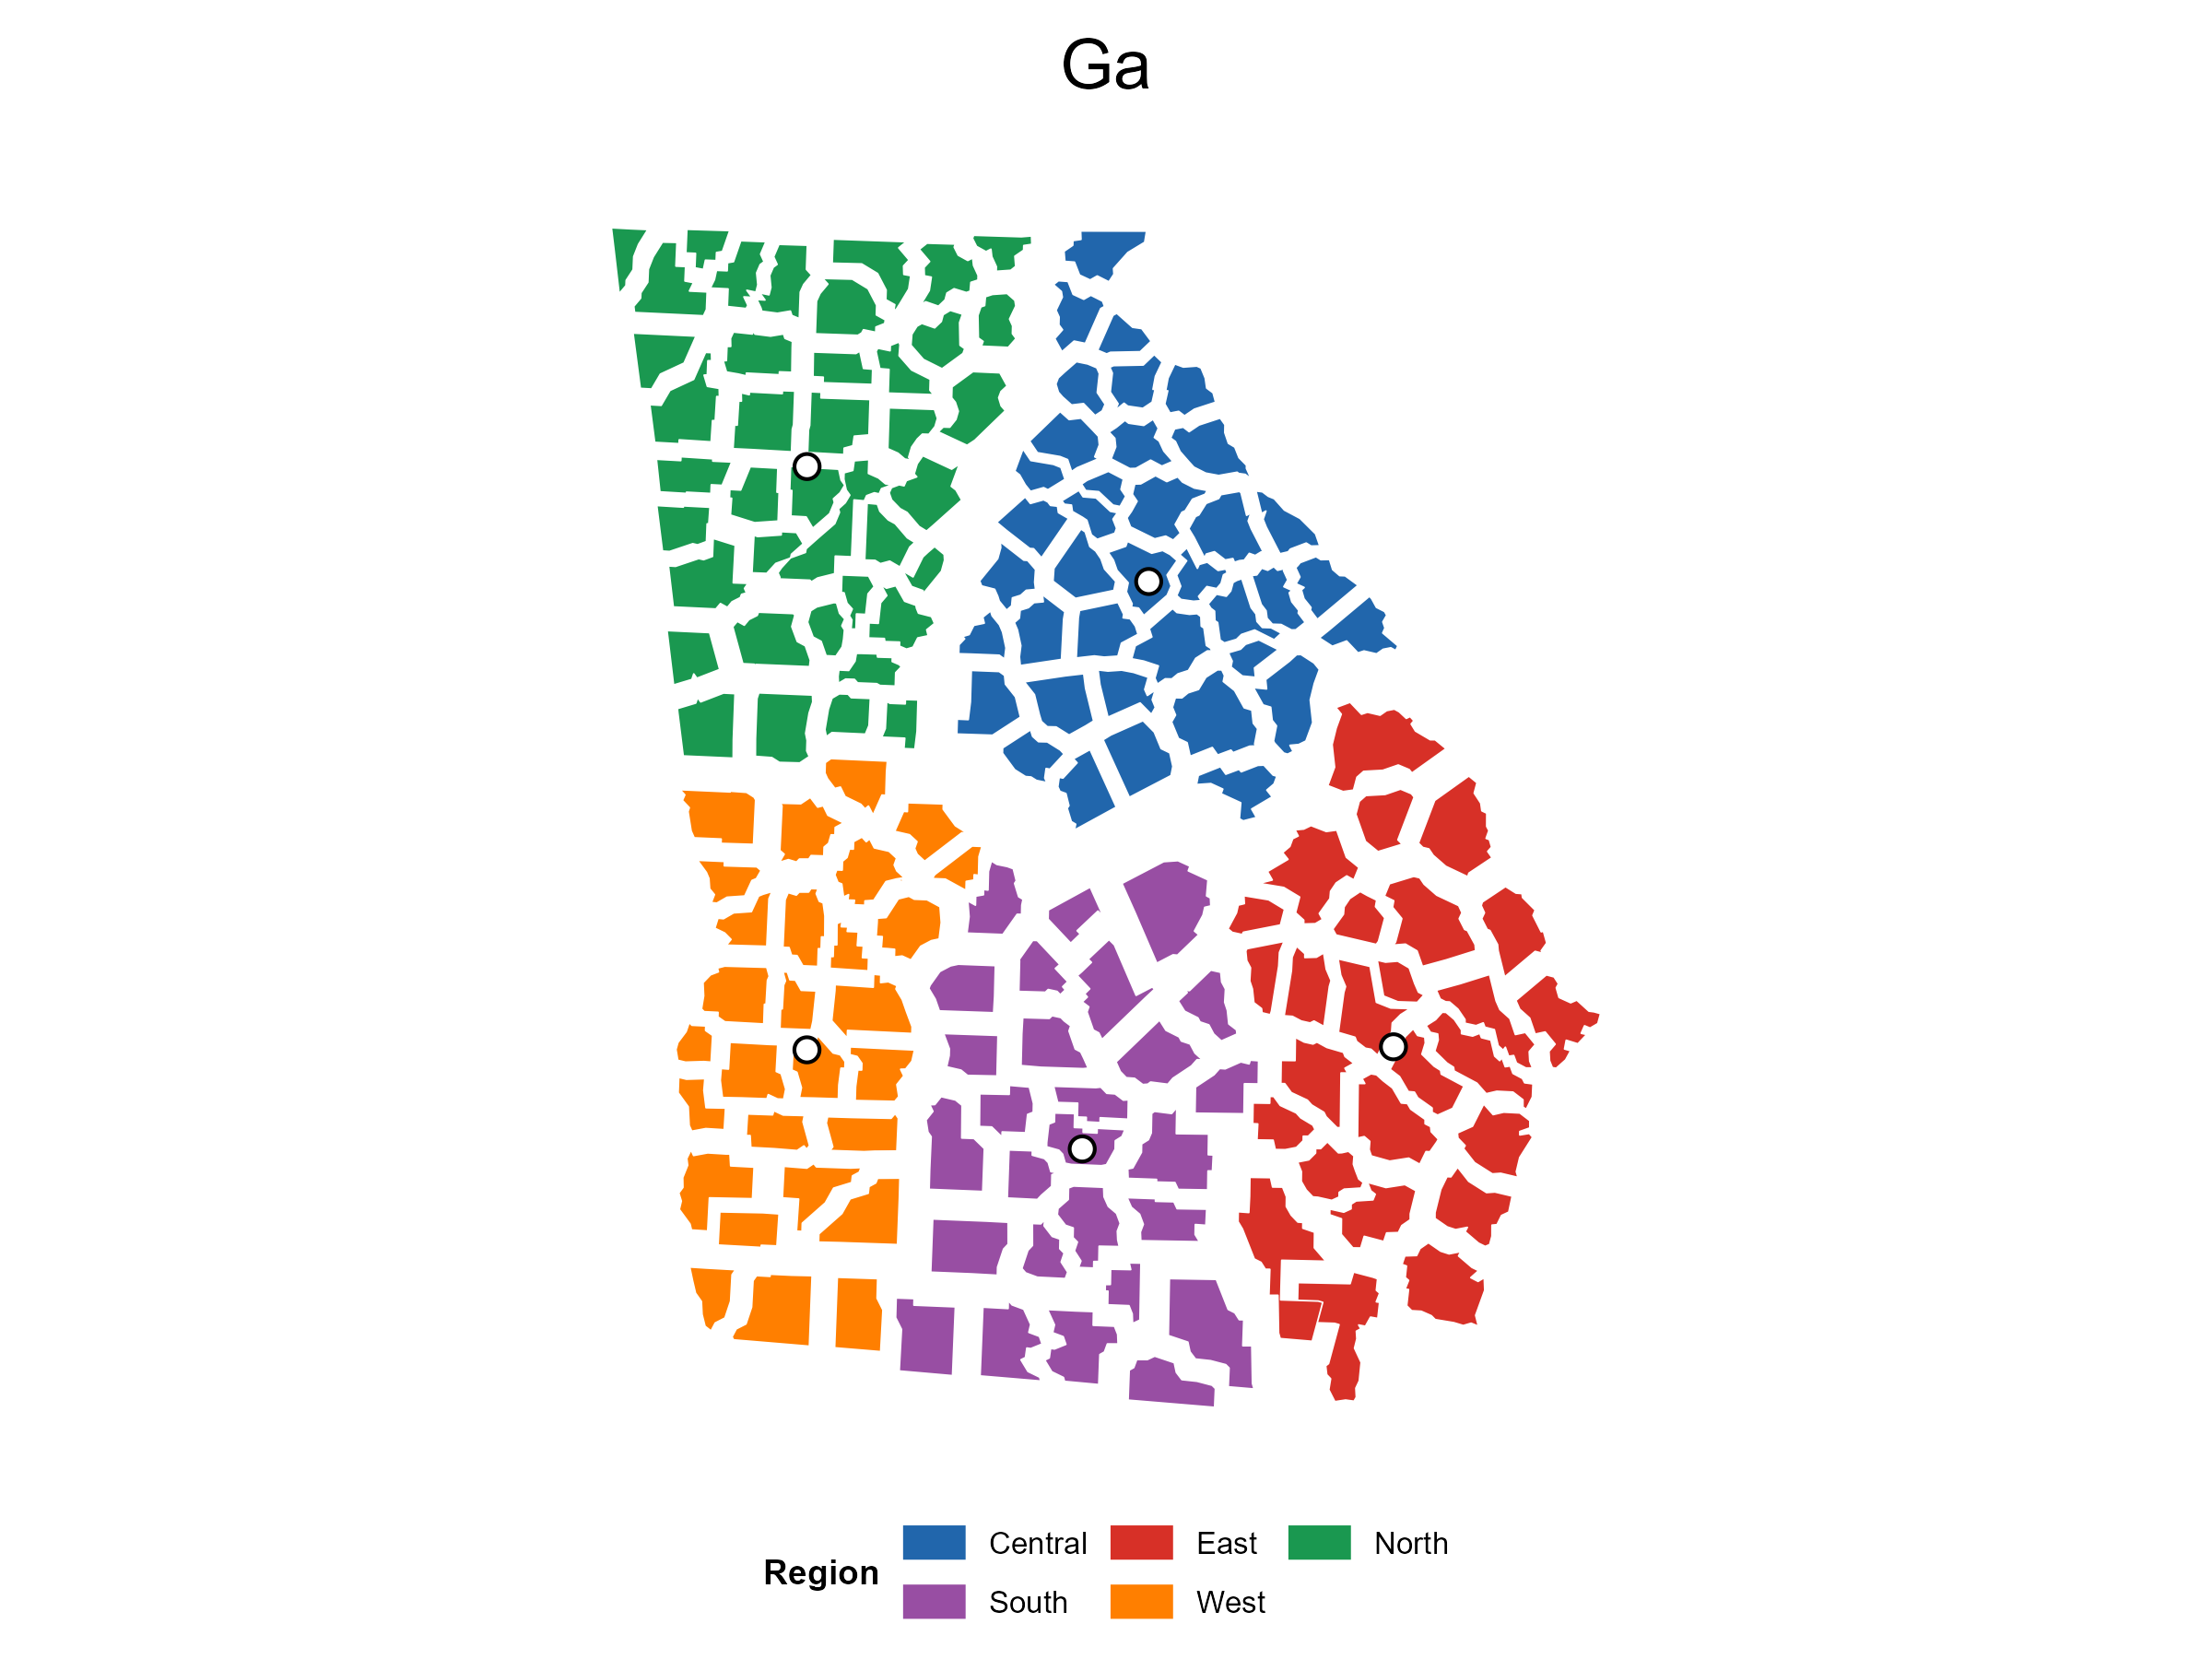
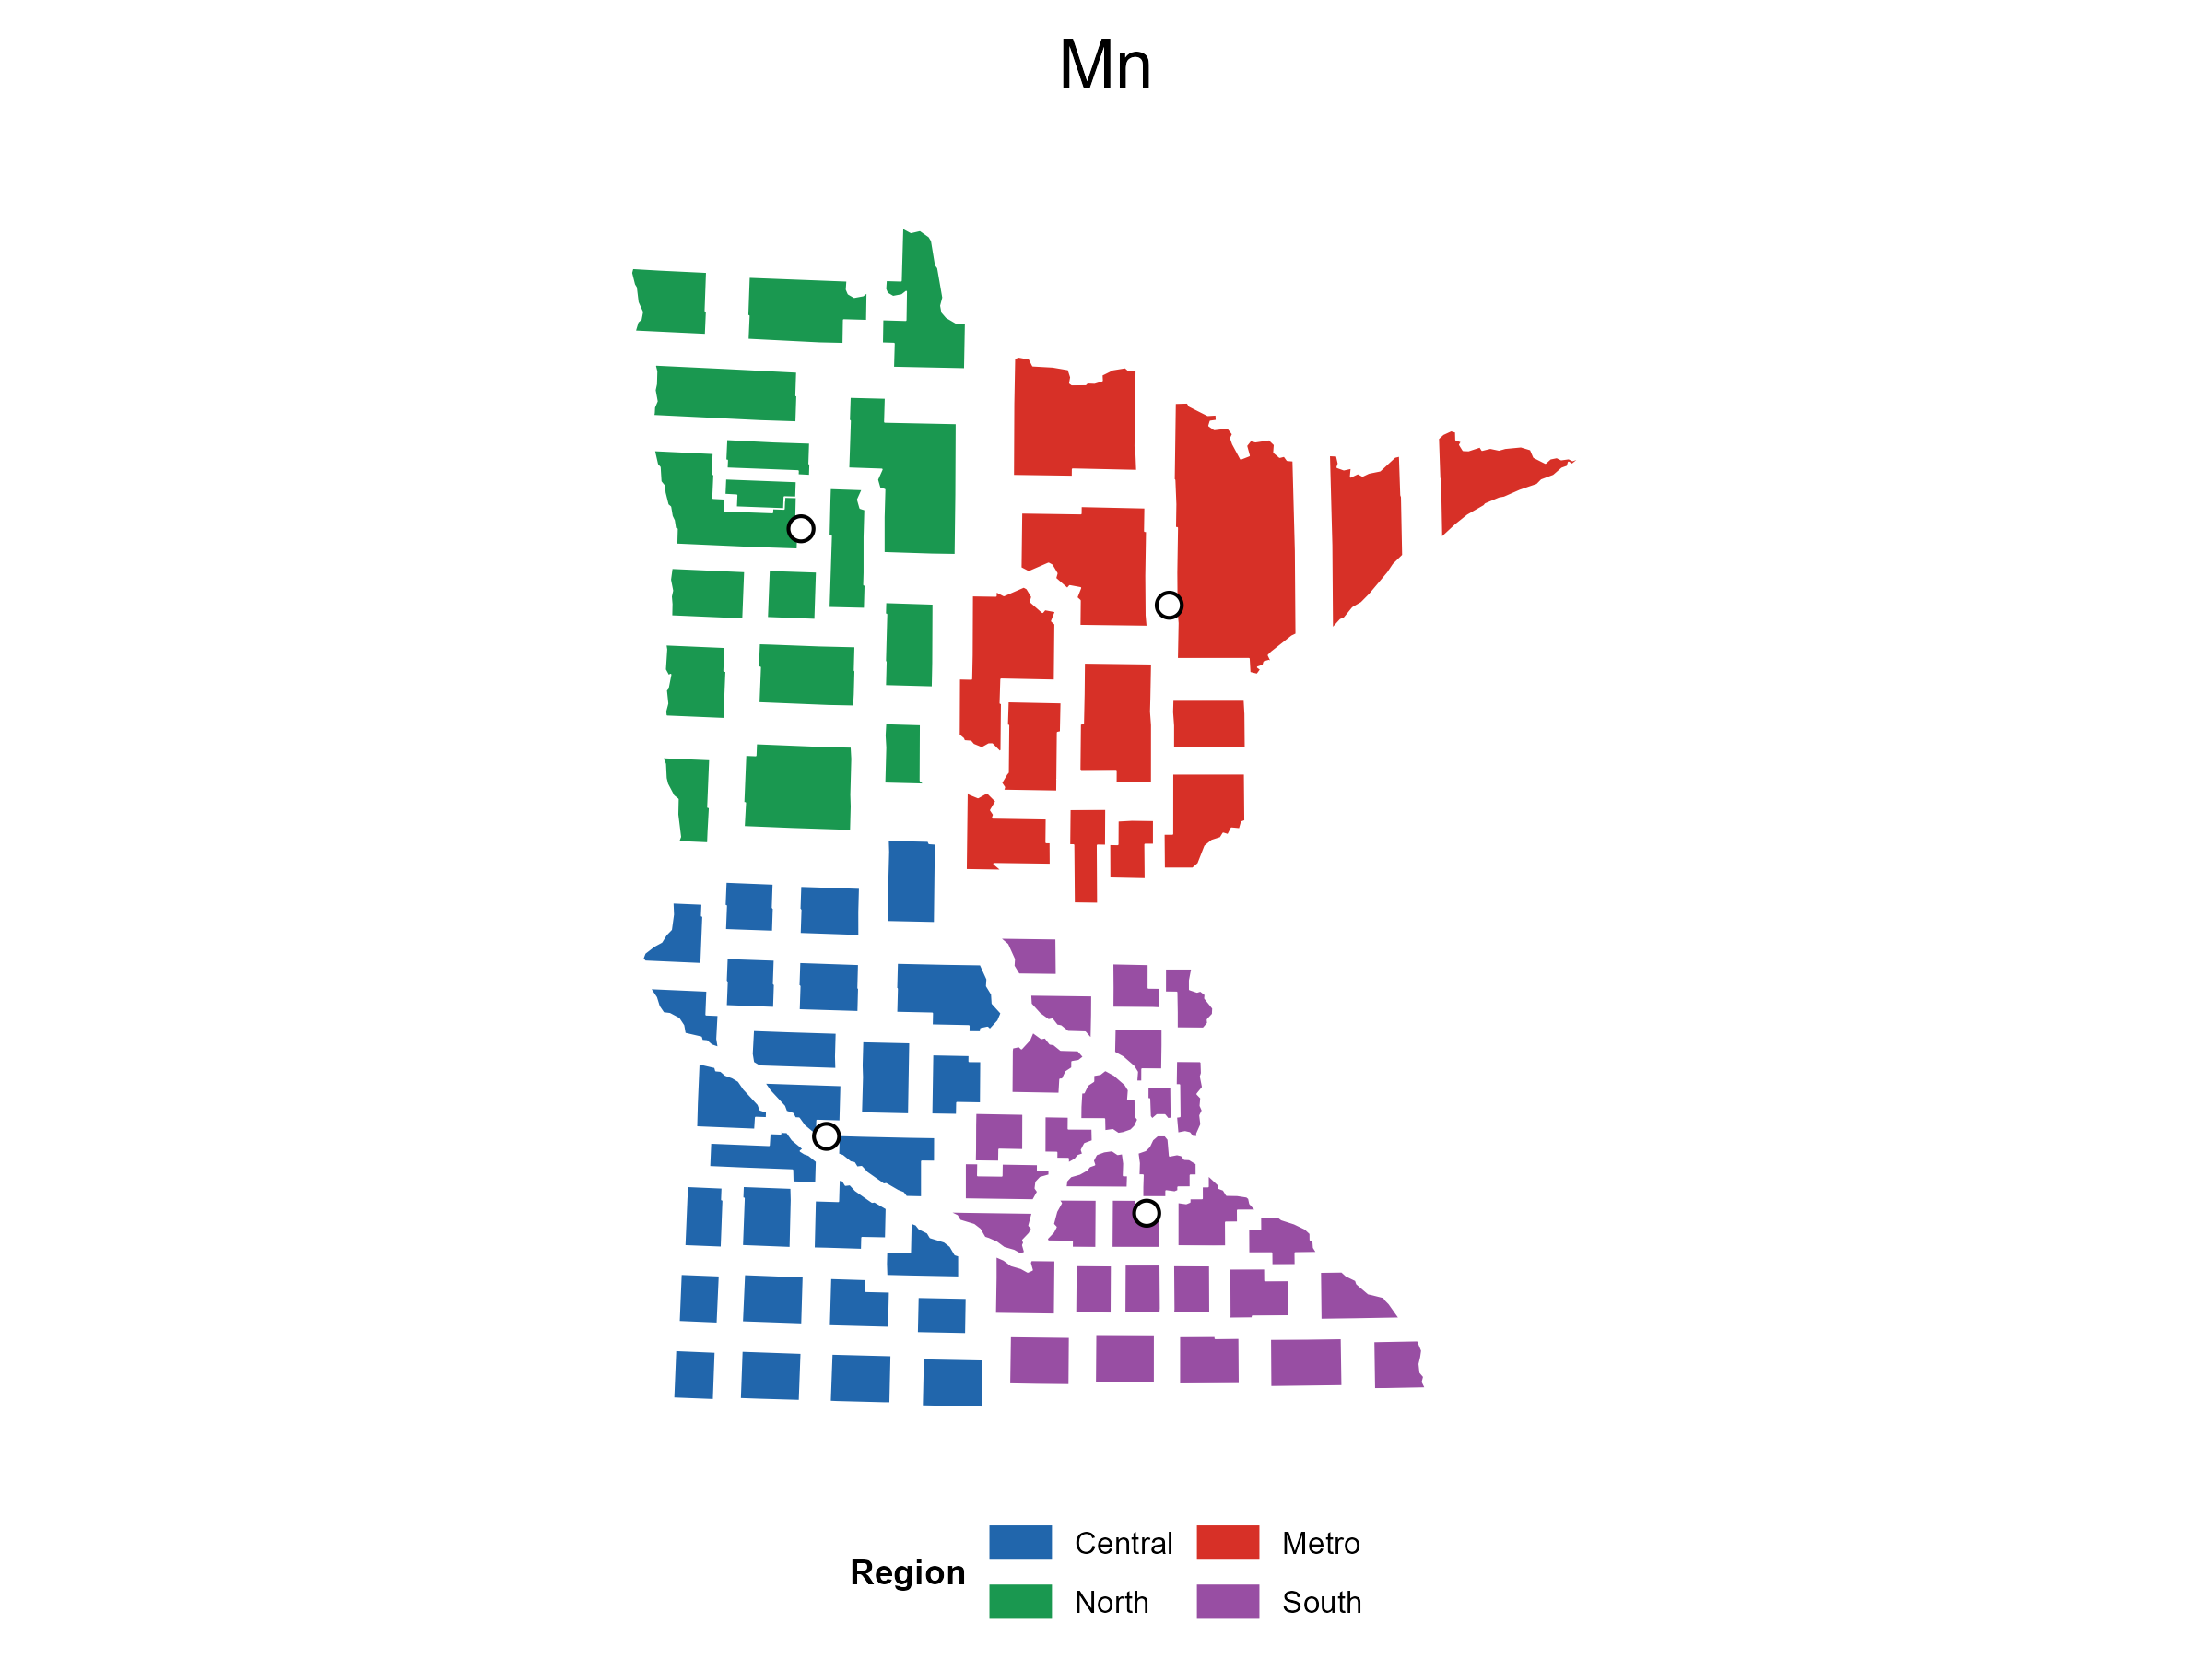
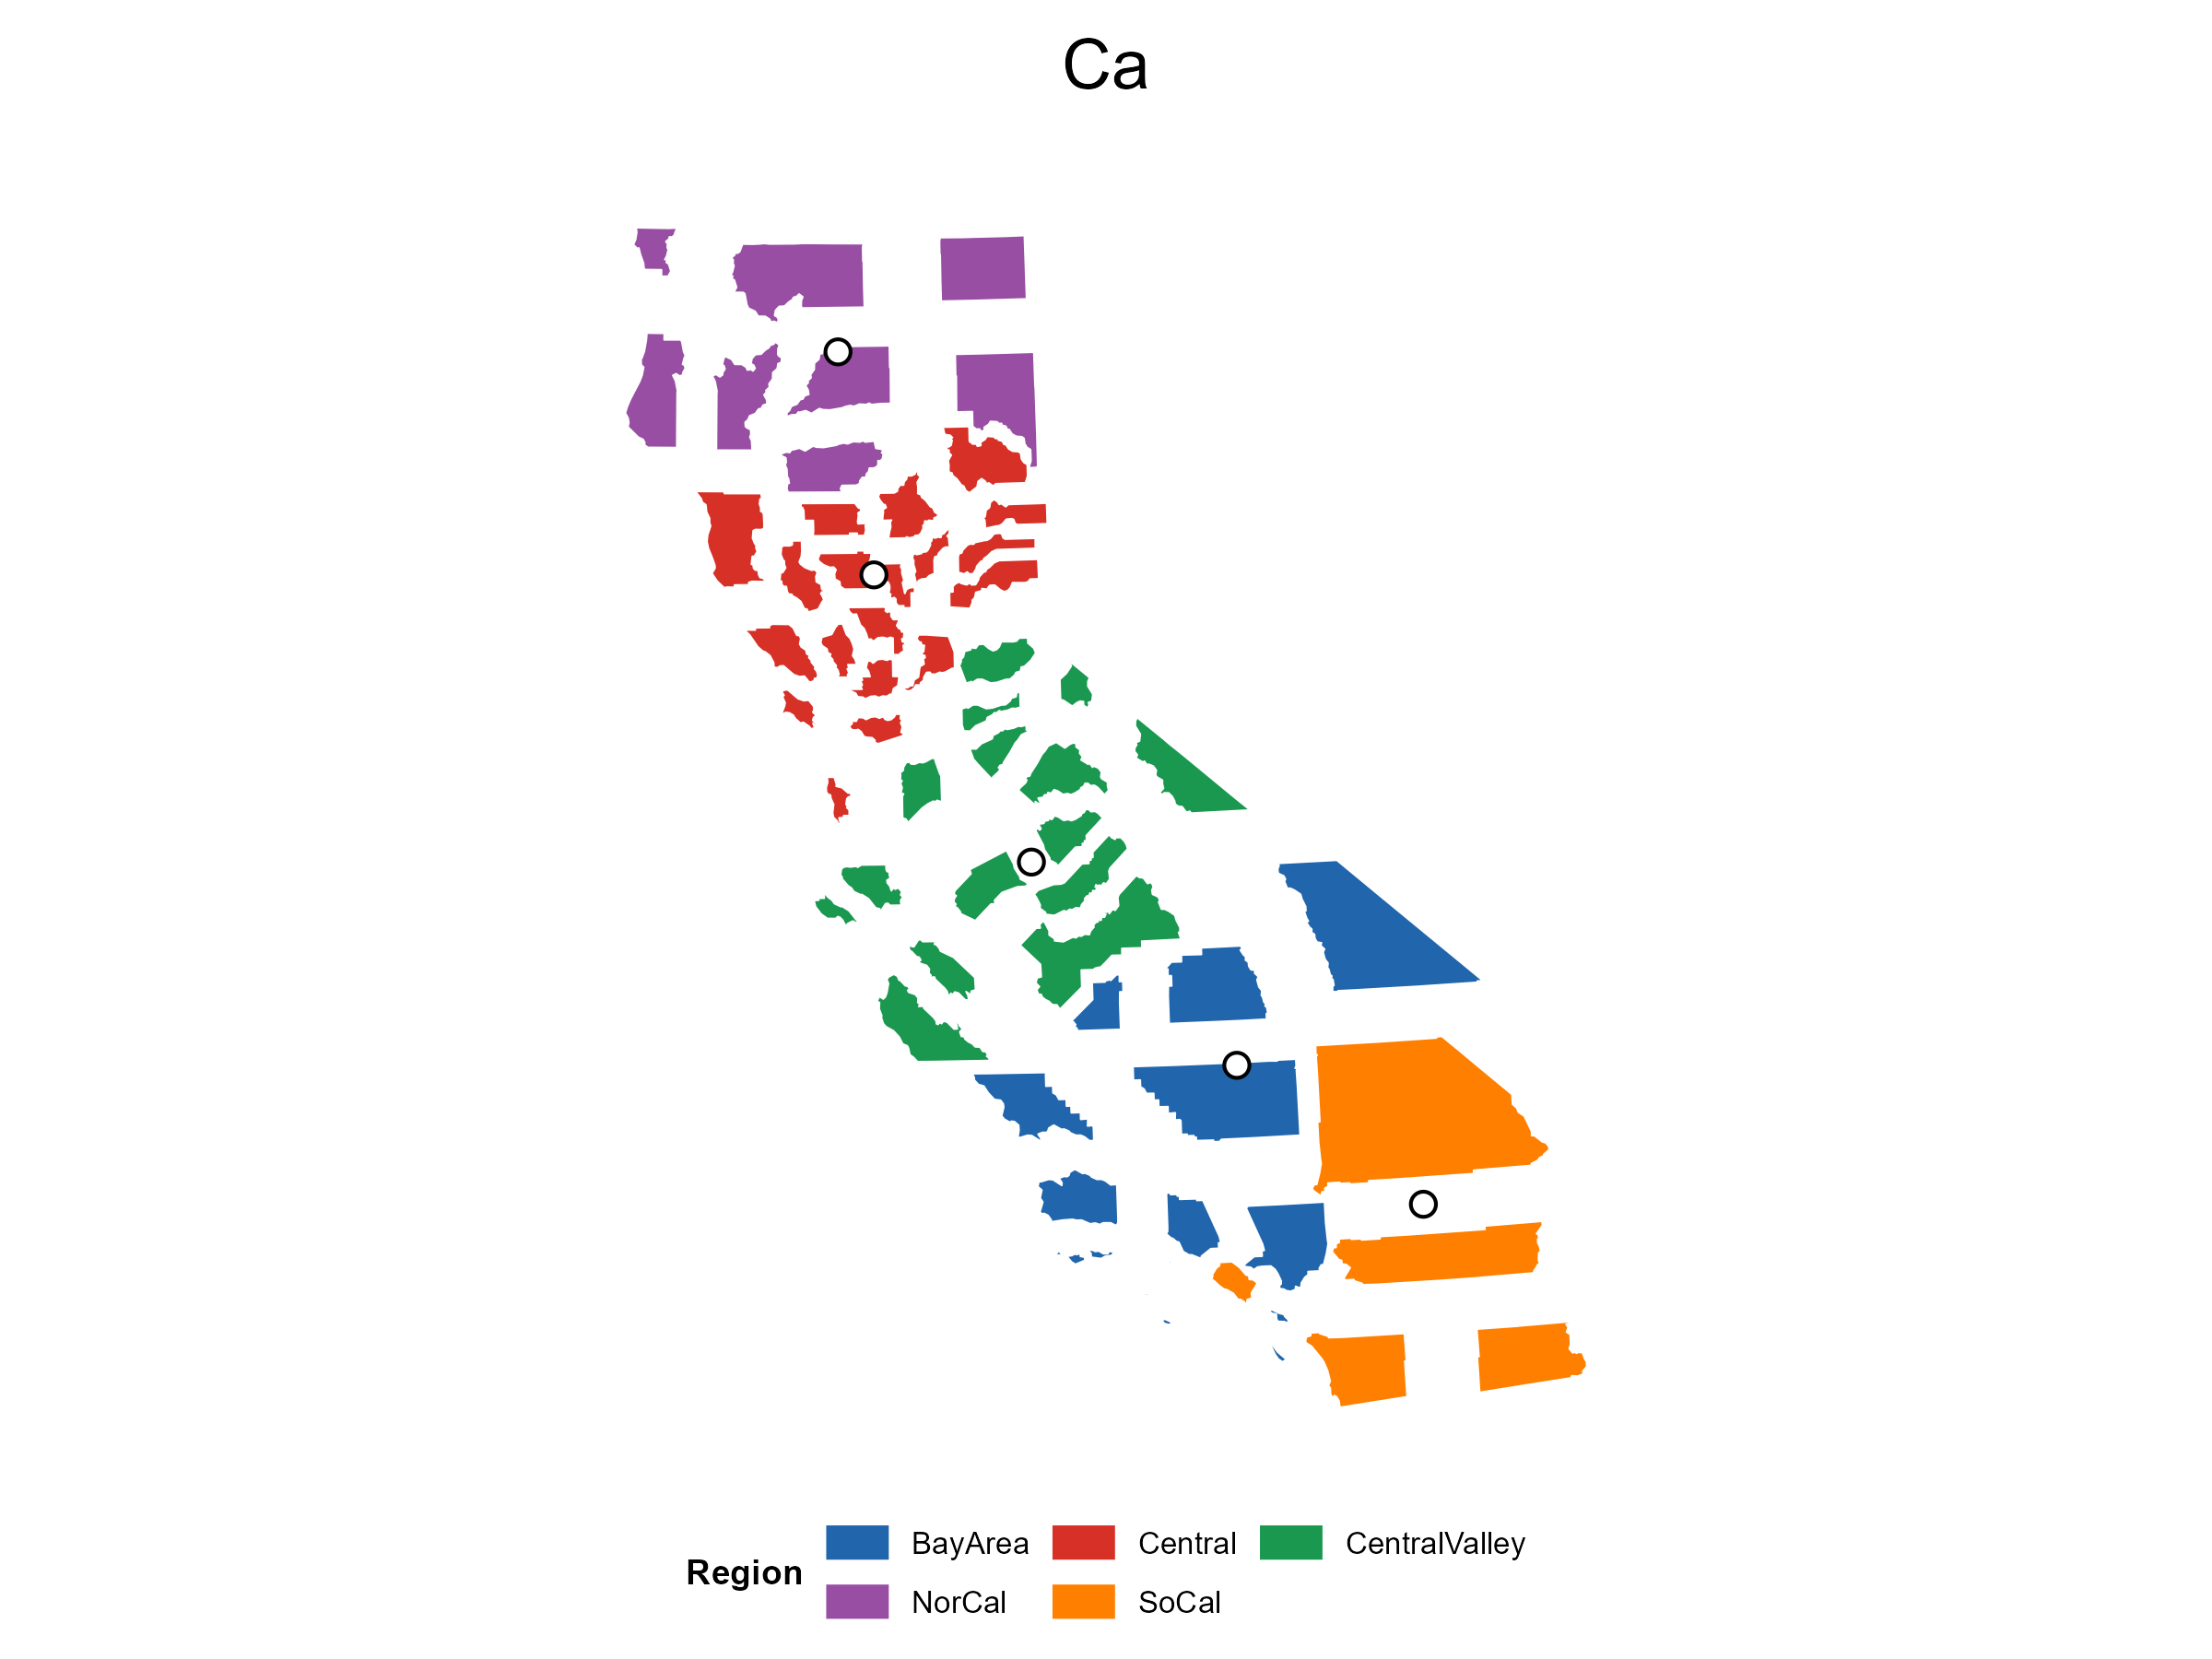
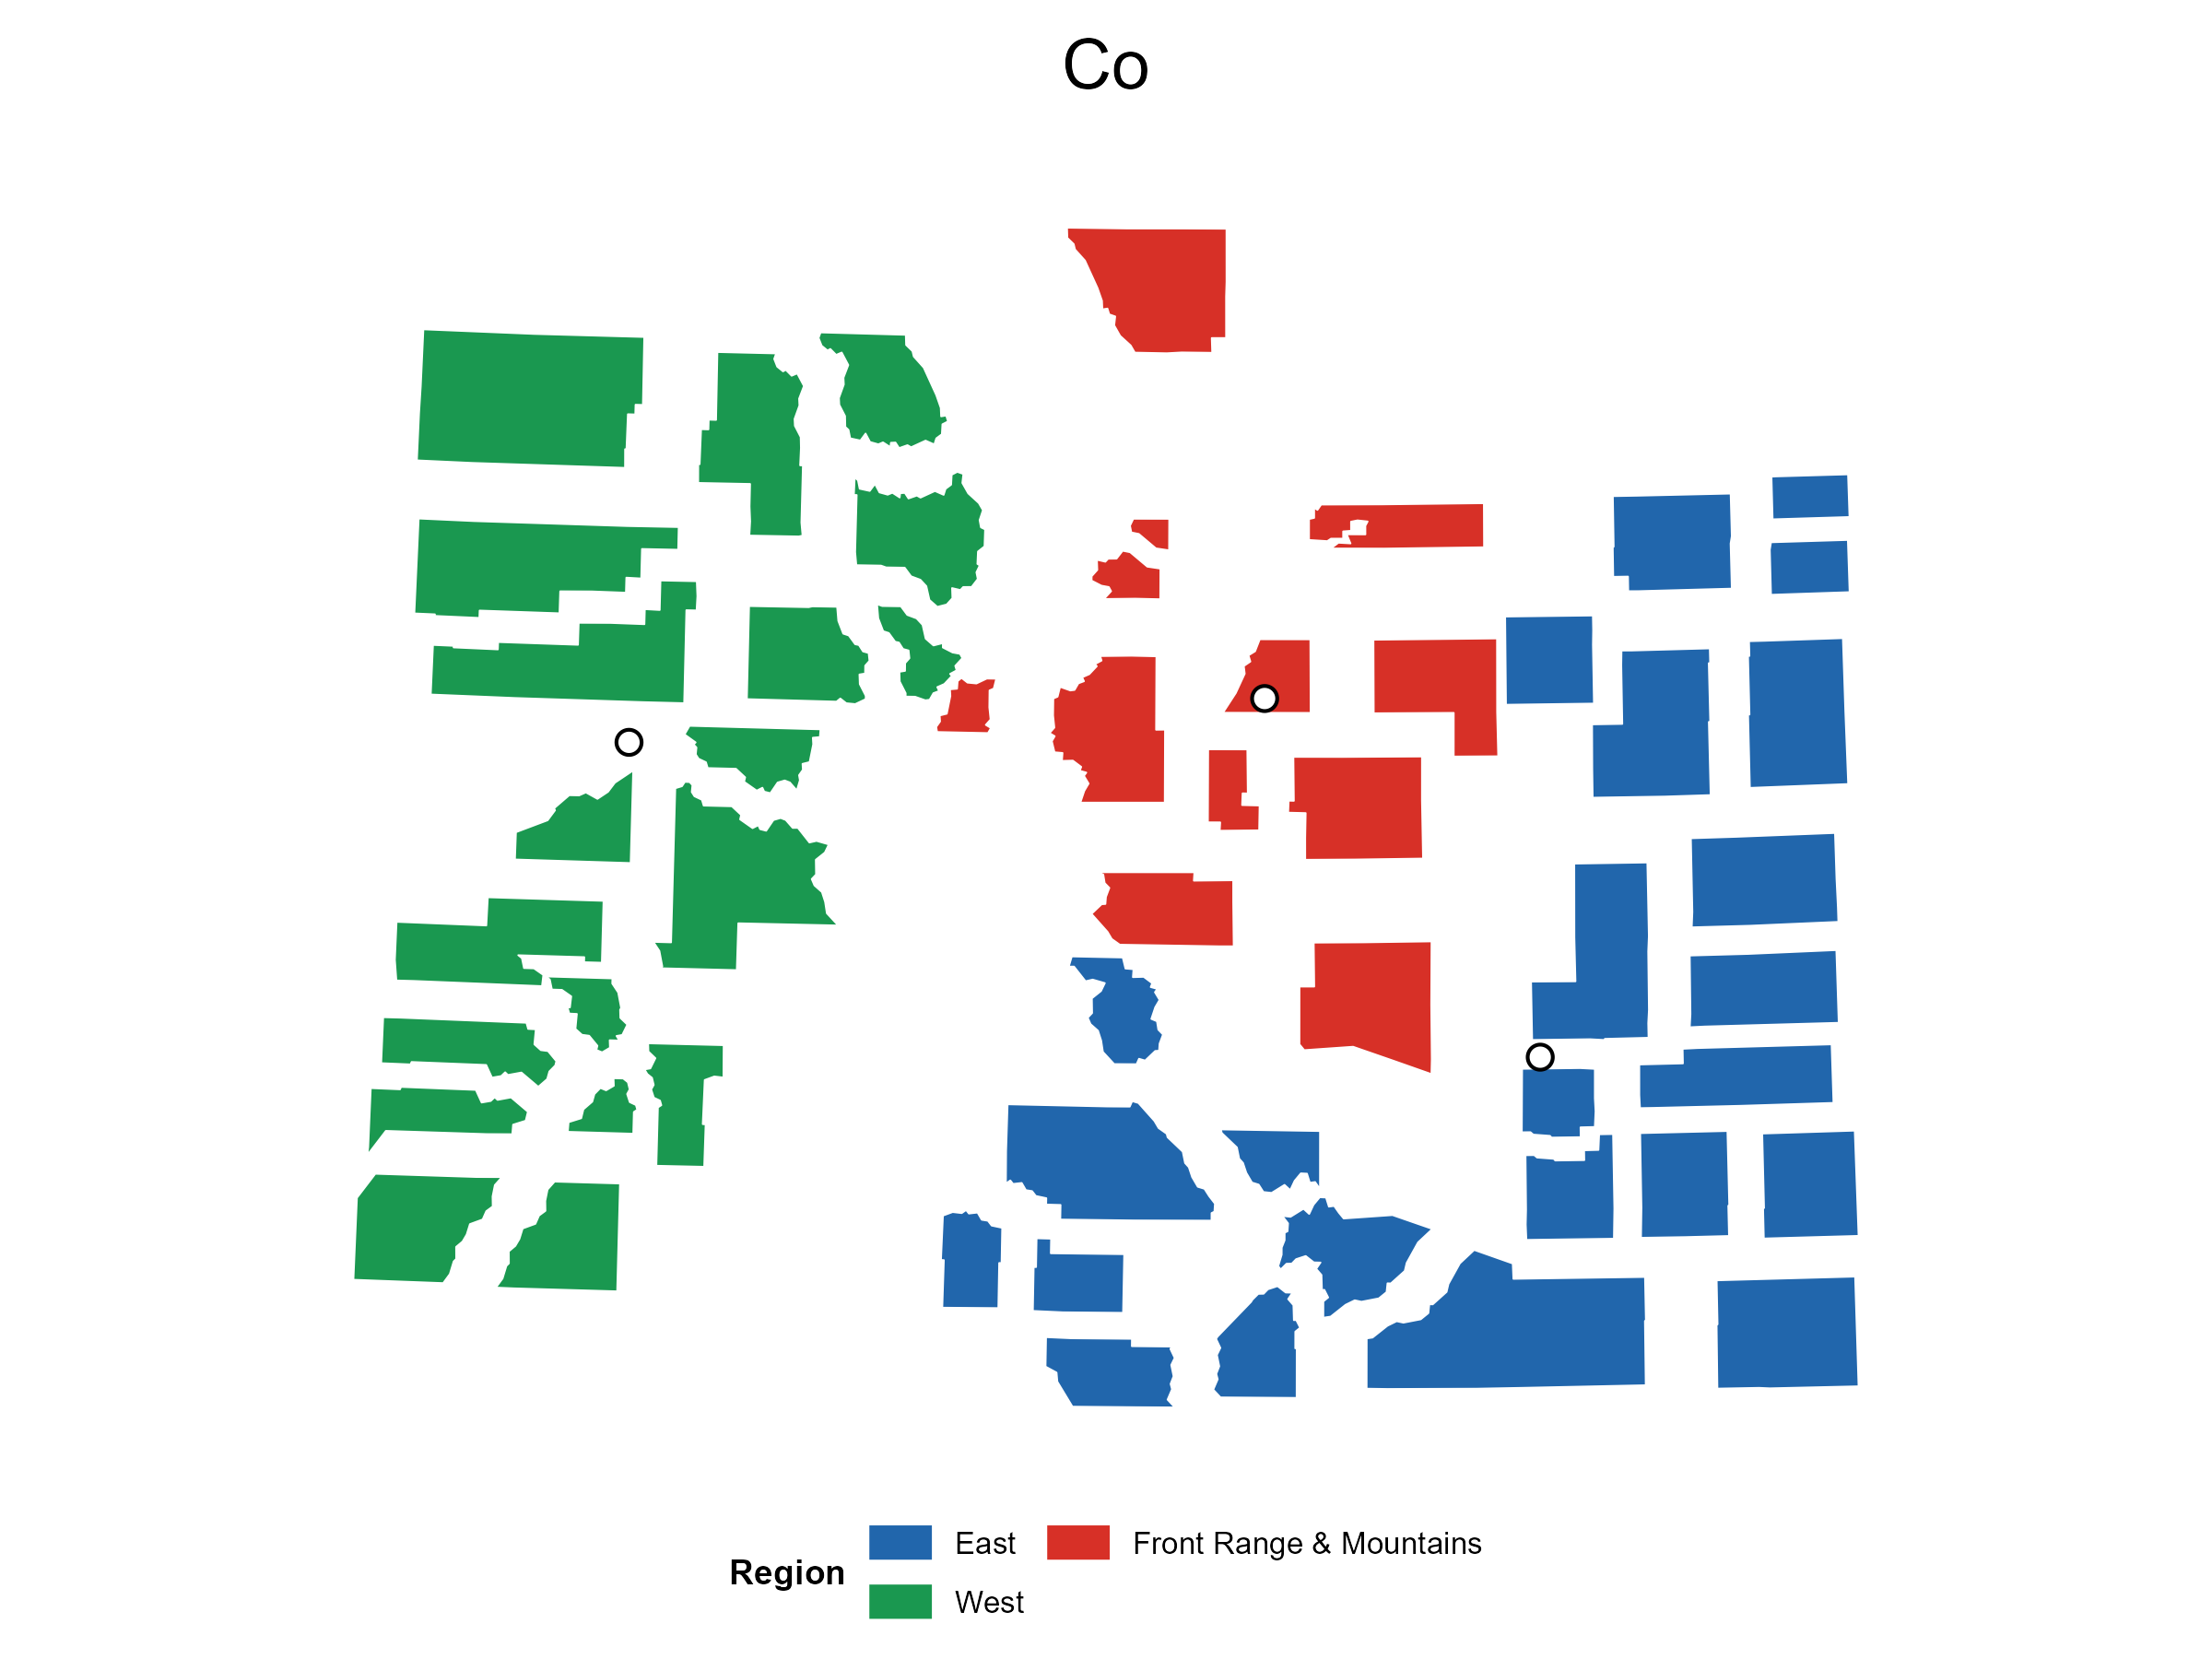
Tennessee offset CSV Georgia offset CSV Minnesota offset CSV California offset CSV Colorado offset CSV
Formula-Derived Validation Parameters
| Case | alpha_r (km) | alpha_l (km) | Units | Manual offsets in metrics? | Offset CSV |
|---|---|---|---|---|---|
| New Jersey | 6.8 | 10 | 564 | No | CSV |
| Pennsylvania | 20.2 | 12.4 | 2,572 | No | CSV |
| Ohio | 23.6 | 17.5 | 1,602 | No | CSV |
| Michigan | 23 | 22.2 | 1,540 | No | CSV |
| Kentucky | 40.7 | 30.7 | 493 | No | CSV |
| Illinois | 23.1 | 19.6 | 1,694 | No | CSV |
| North Dakota | 18.8 | 18.2 | 1,761 | No | CSV |
| North Carolina | 20.3 | 23.1 | 1,041 | No | CSV |
| Virginia | 36.9 | 30.9 | 582 | No | CSV |
| Texas | 79 | 39.7 | 862 | No | CSV |
| Florida | 47.7 | 43.6 | 316 | No | CSV |
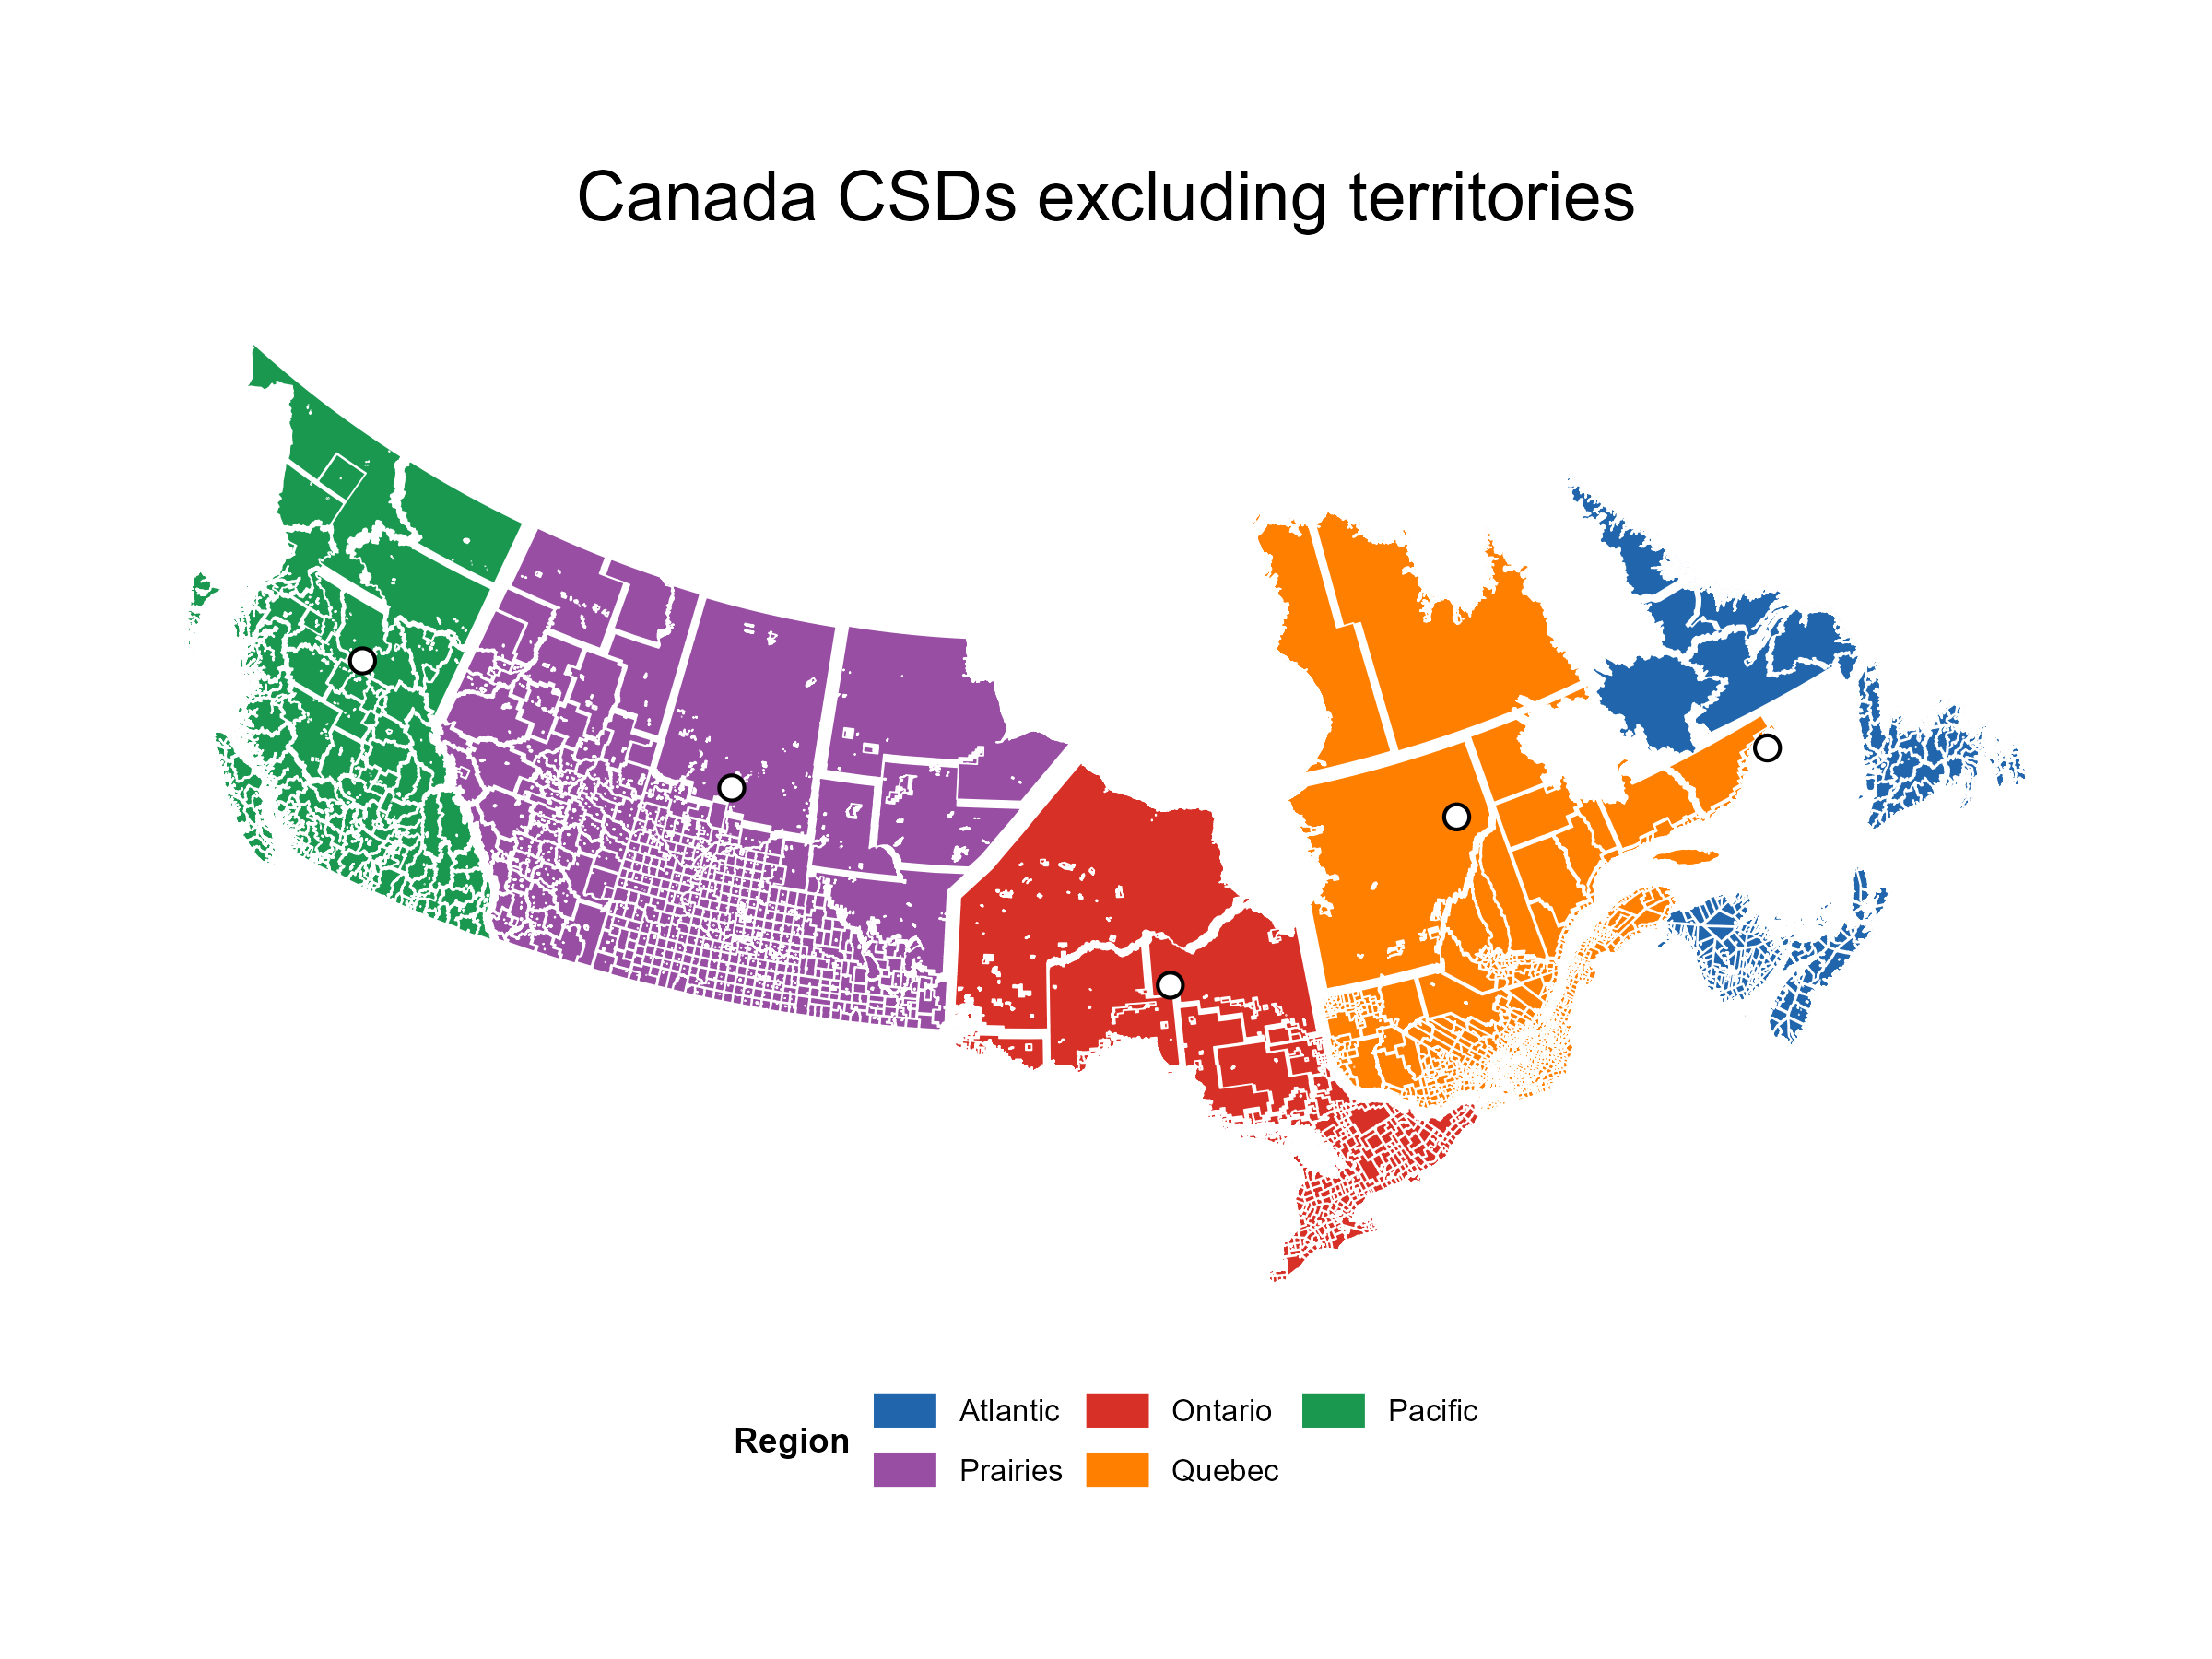
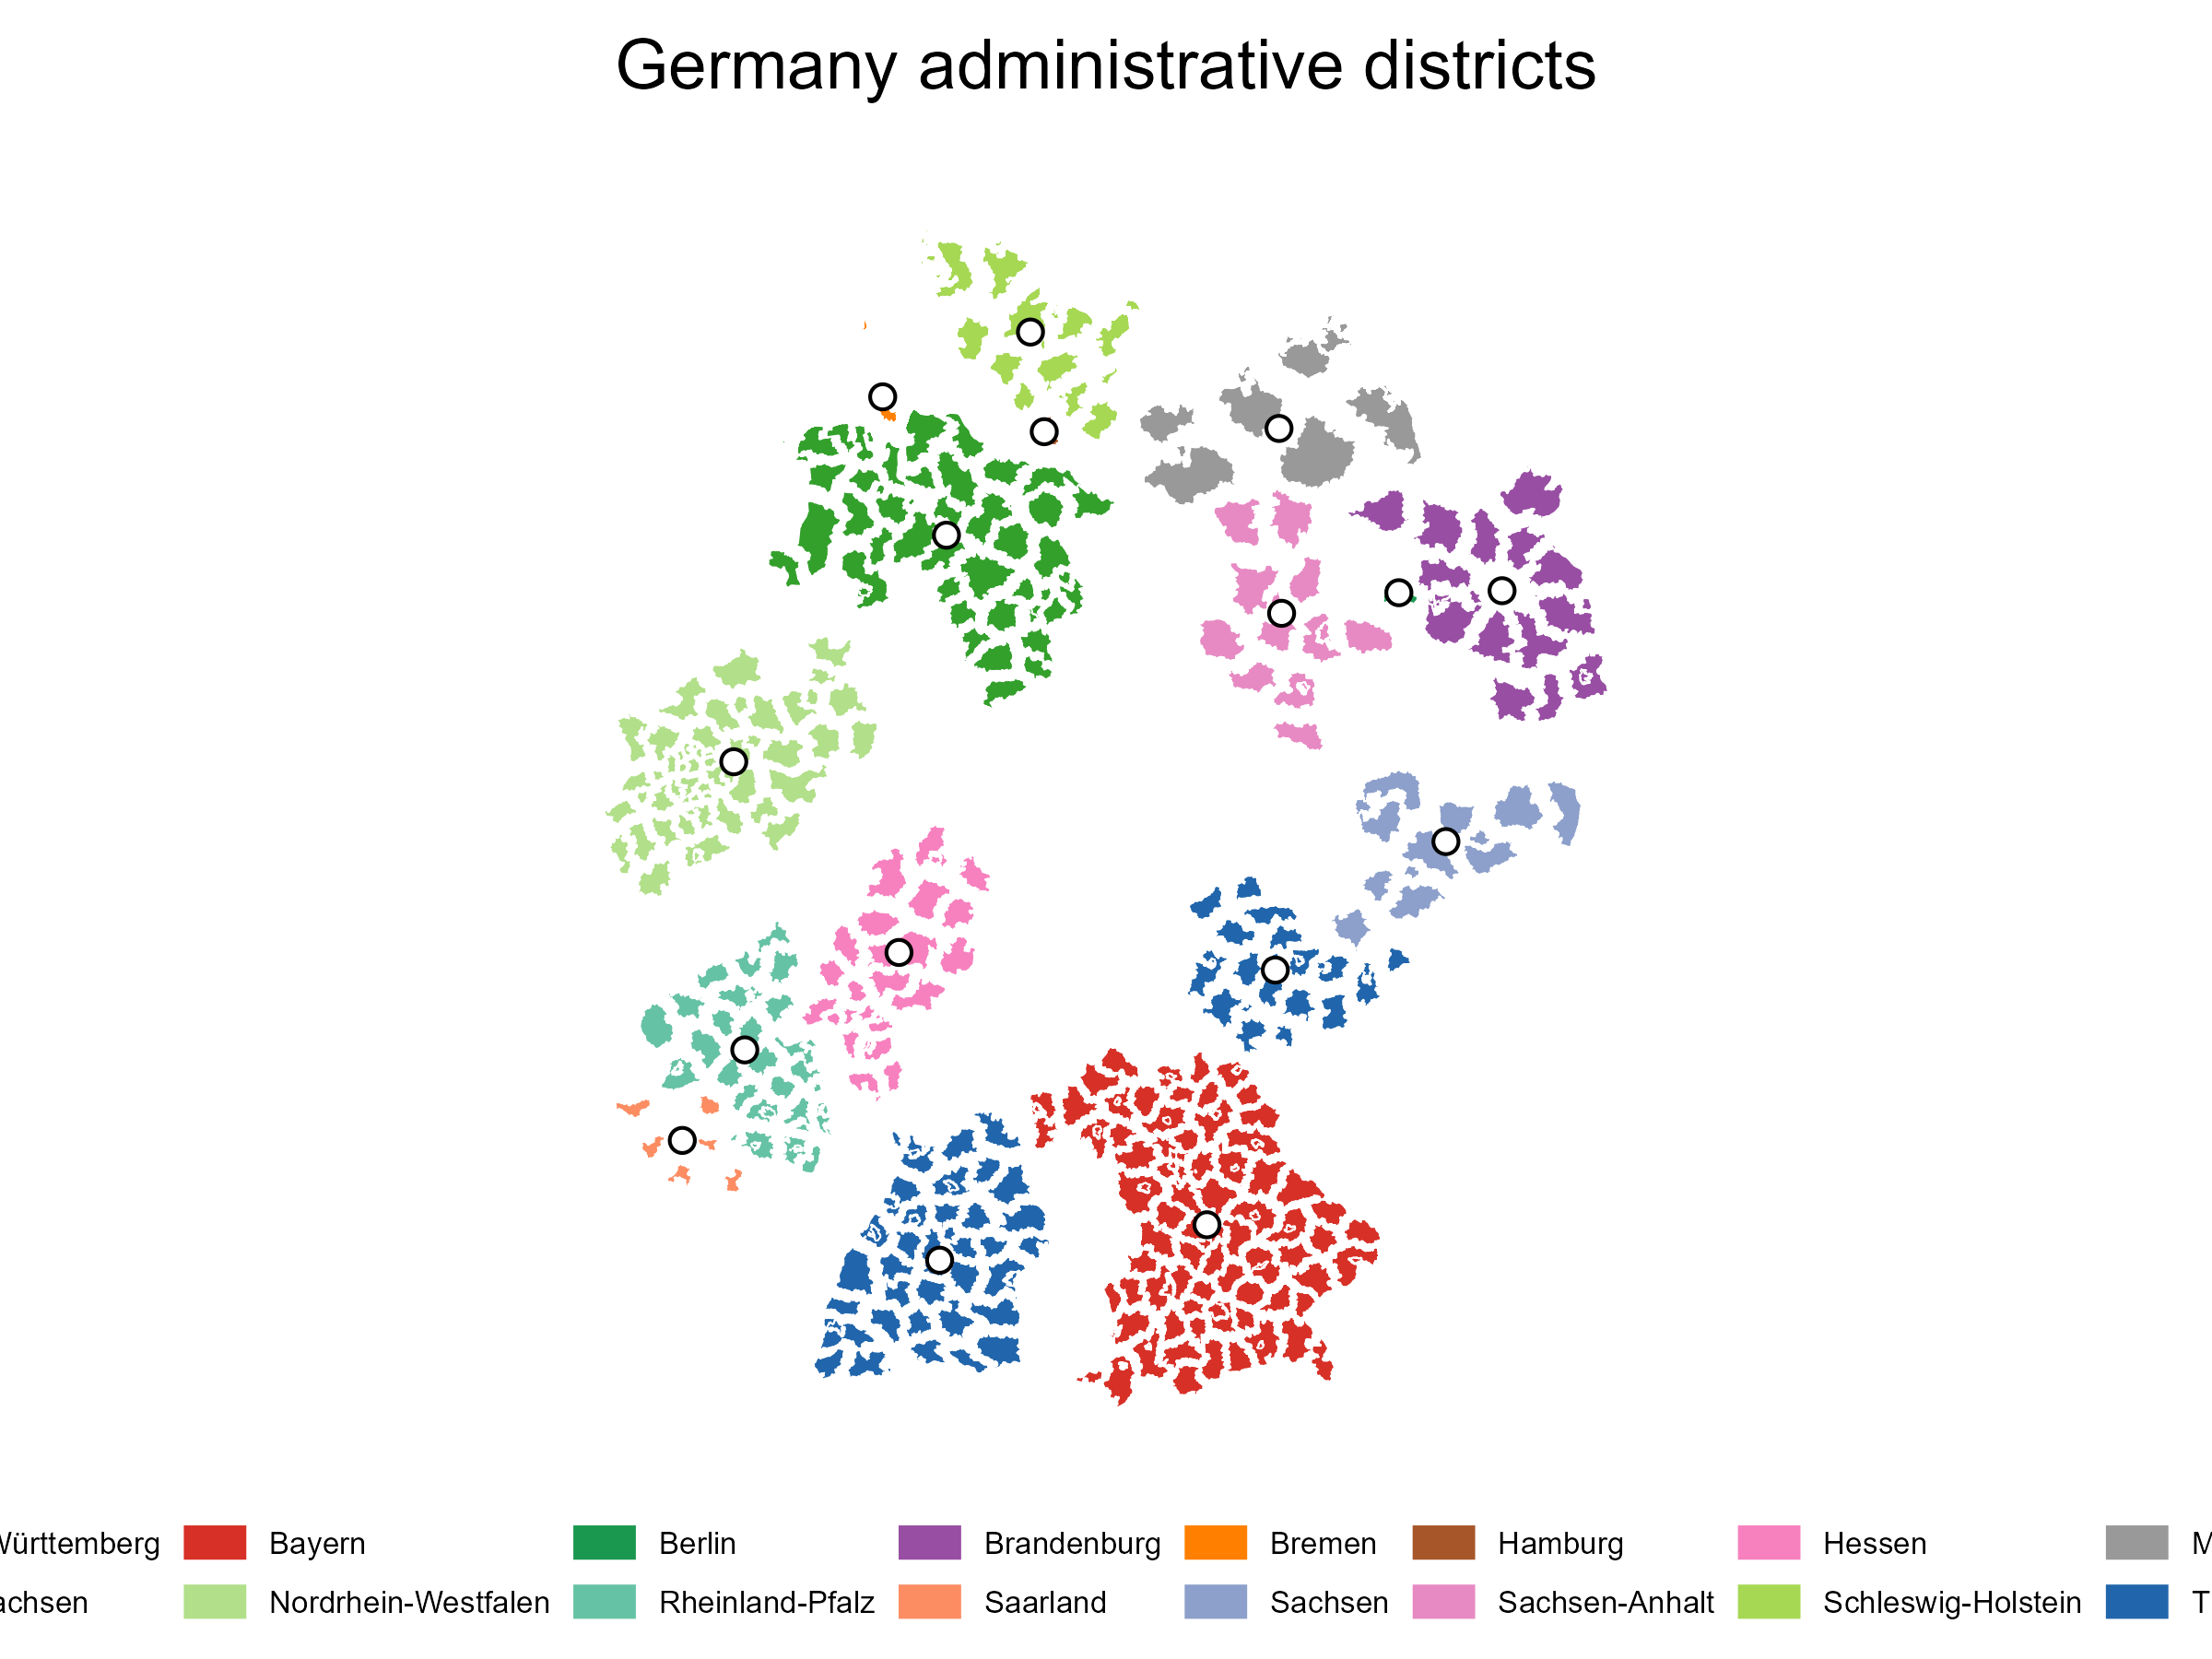
Canada/Germany
Canada and Germany illustrate multi-region transfer outside the main U.S. municipal calibration set. Canada is included in the quantitative table; Germany is included as a display and stress-test example.
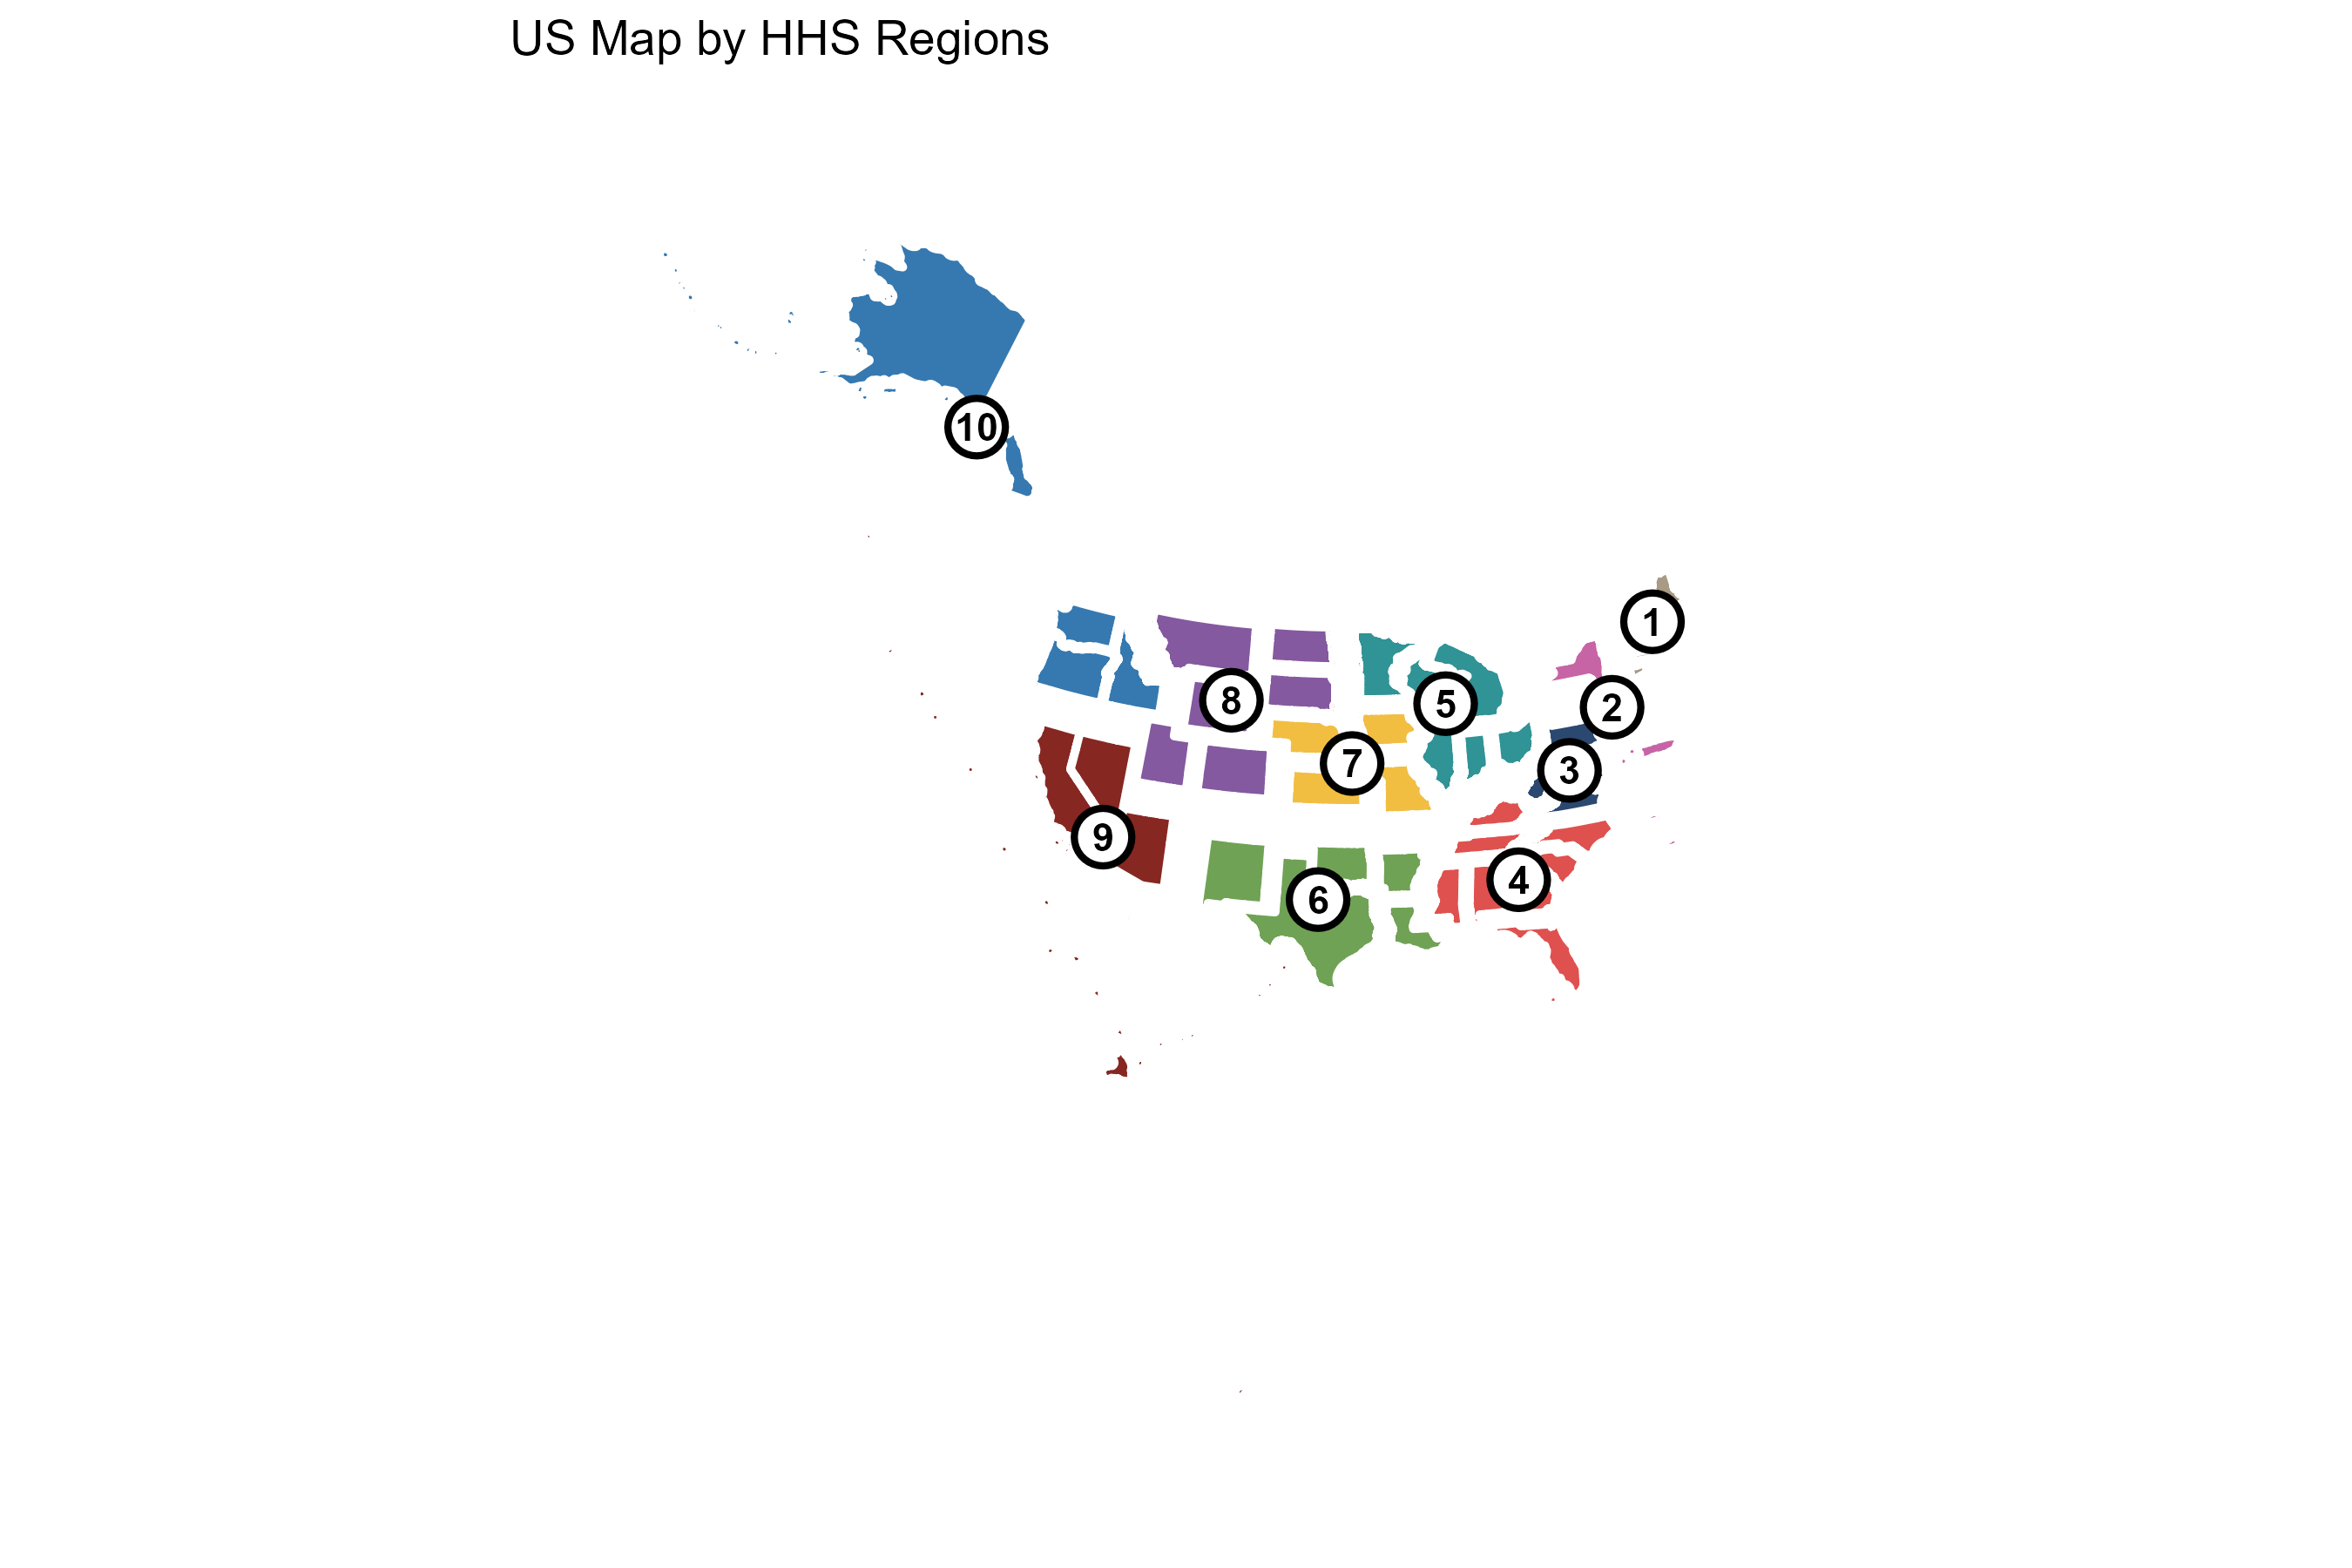
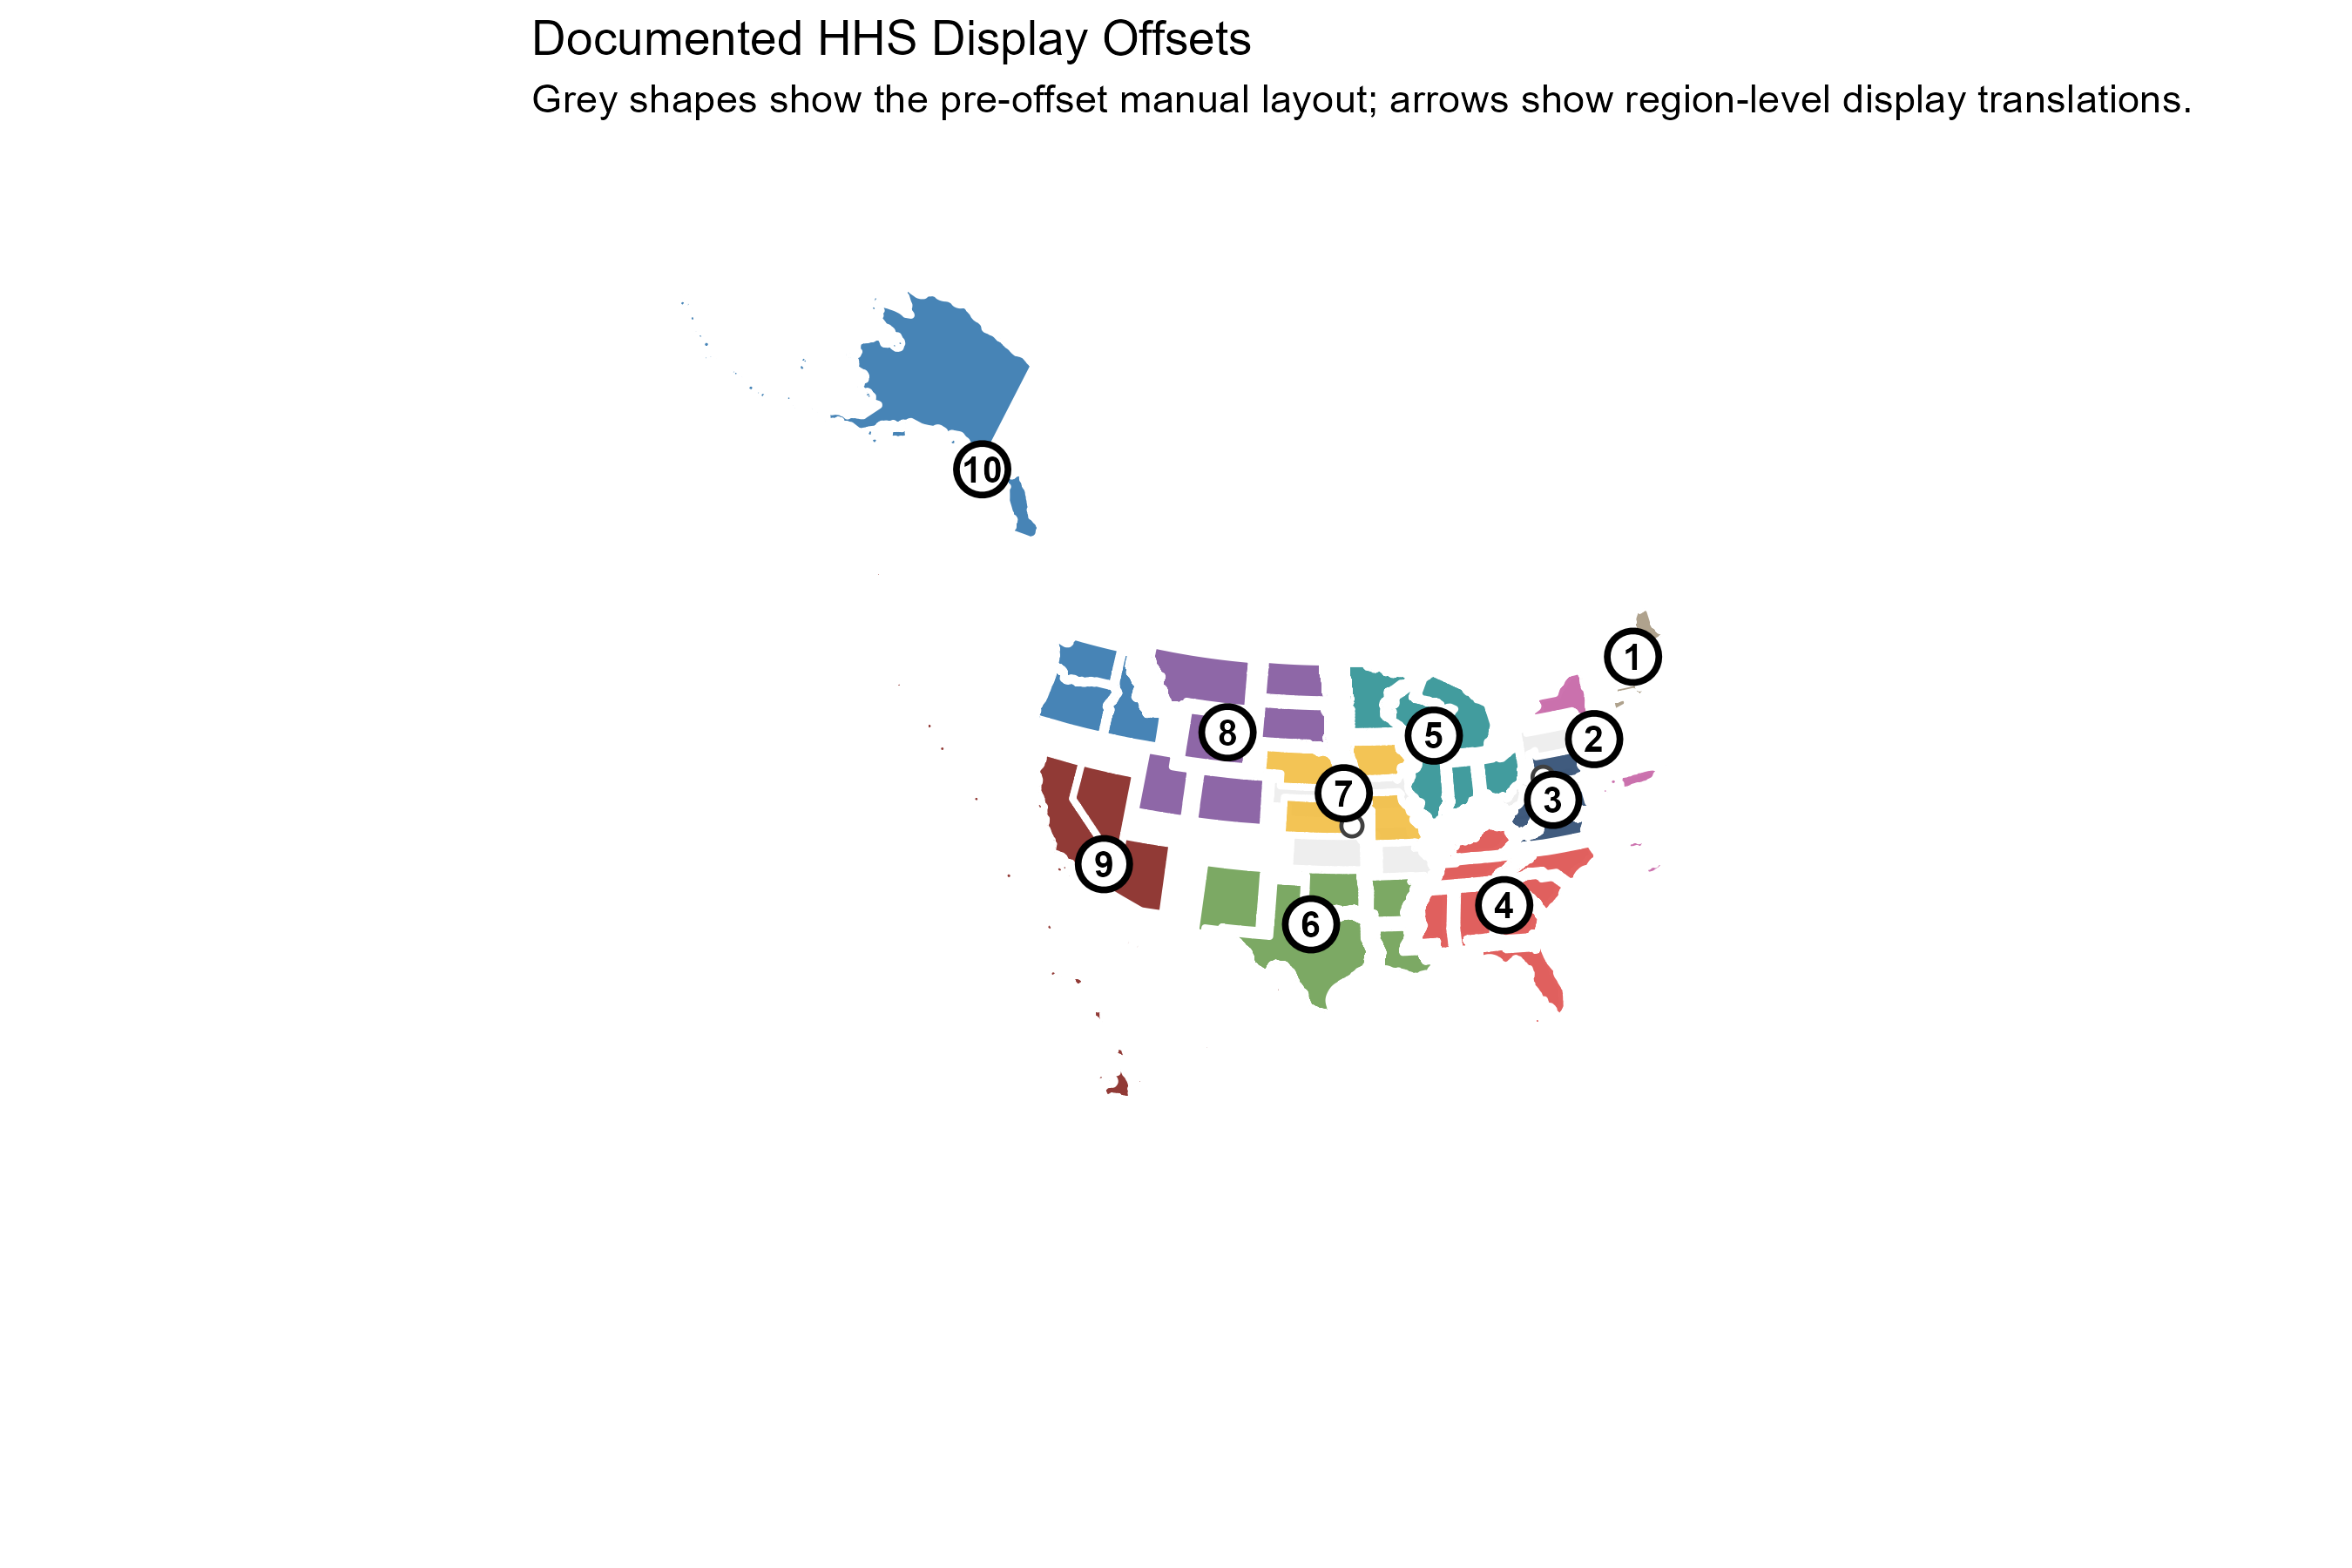
HHS National Grouped Layout
The HHS example uses numbered region labels, with region membership defined in the manuscript table. The second figure documents the display-offset movement used to clean up the final publication layout.
Download Data/Code
The publication figures are generated from the package source, paper scripts, and documented offset tables. The repository contains the regeneration scripts under paper/scripts; this page mirrors the figures and small CSV outputs needed to audit the display-offset layouts.
Paper scripts Cross-state metrics CSV Rendered-layout index CSV Repository