Draws a quick base-graphics plot of a dependency graph. Vertices that are
calculated fields (present in fields_df$name) are drawn differently.
Arguments
- g
An
igraphdirected graph frombuild_dependency_graph().- fields_df
Optional data frame with a
namecolumn to mark calculated outputs.- seed
Optional integer seed to make the layout reproducible. If
NULL(default), the function will not alter the caller's RNG state.
Examples
fields <- tibble::tibble(
name = c("X_plus_Y", "Z"),
formula = c("[X] + [Y]", "[X_plus_Y] * 2")
)
g <- build_dependency_graph(fields)
plot_dependency_graph(g, fields) # nondeterministic layout
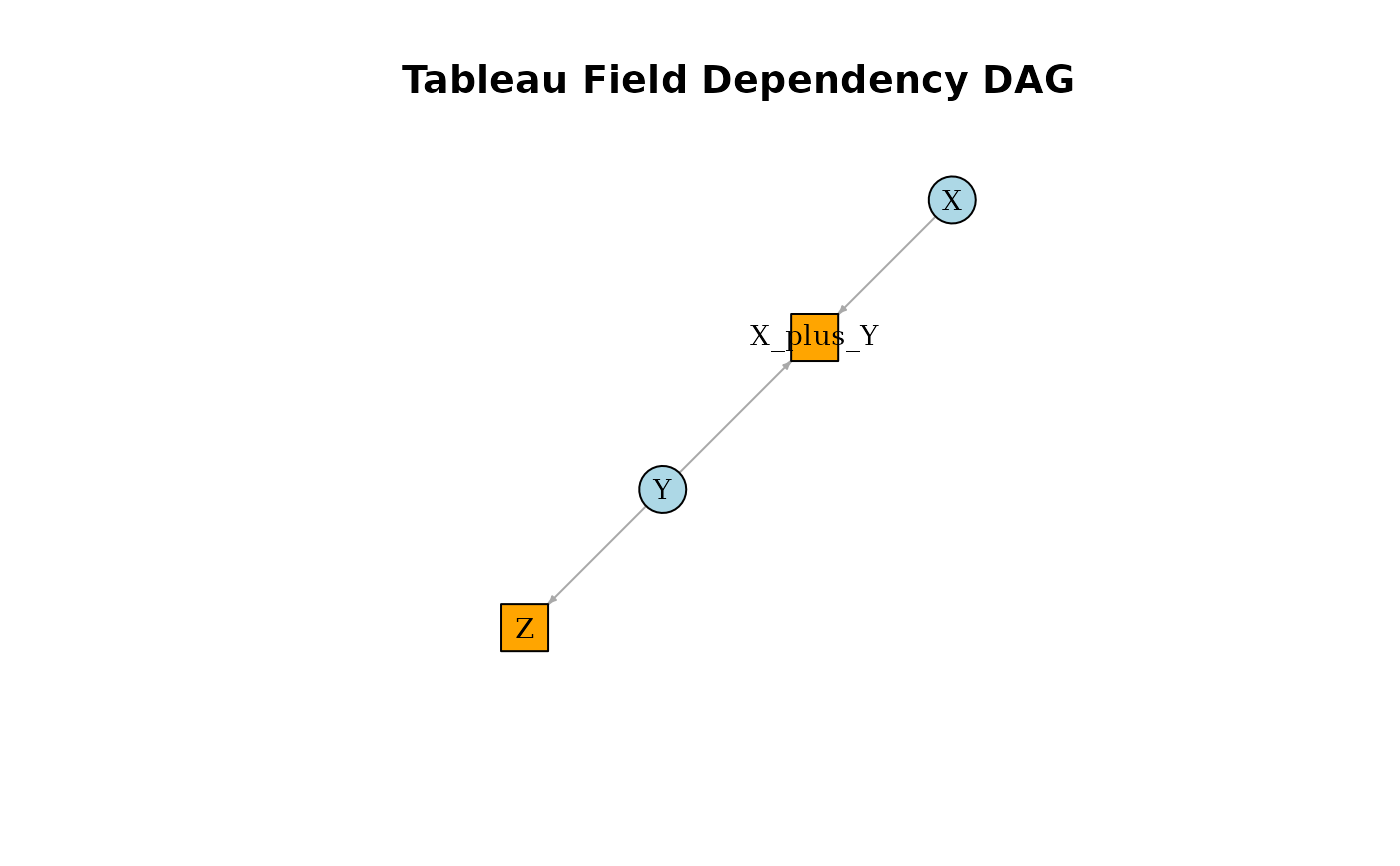 plot_dependency_graph(g, fields, seed = 1) # deterministic layout
